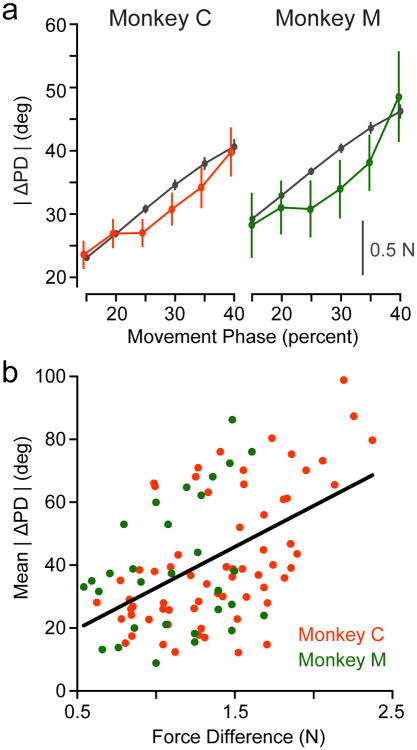
Fig. 5. Neural PD changes depend on force.
a) We fit PDs for all single units in overlapping, sliding time windows beginning at movement onset and computed ΔPD between Baseline and Adaptation in each window. Values represent mean ± SEM across the cells that were tuned in any given window. This plot compares the time-varying change in RMS force measured at the handle (black lines, scale bar) with the population ΔPD (red for Monkey C, green for Monkey M, left axis) in each window. b) Each data point shows the per-session average of the ΔPD change observed in each of the time windows shown in Figure 5a plotted against the difference in endpoint force in that window. The fitted line gives the relationship ΔPD = 6.6° + 26° × ΔForce

