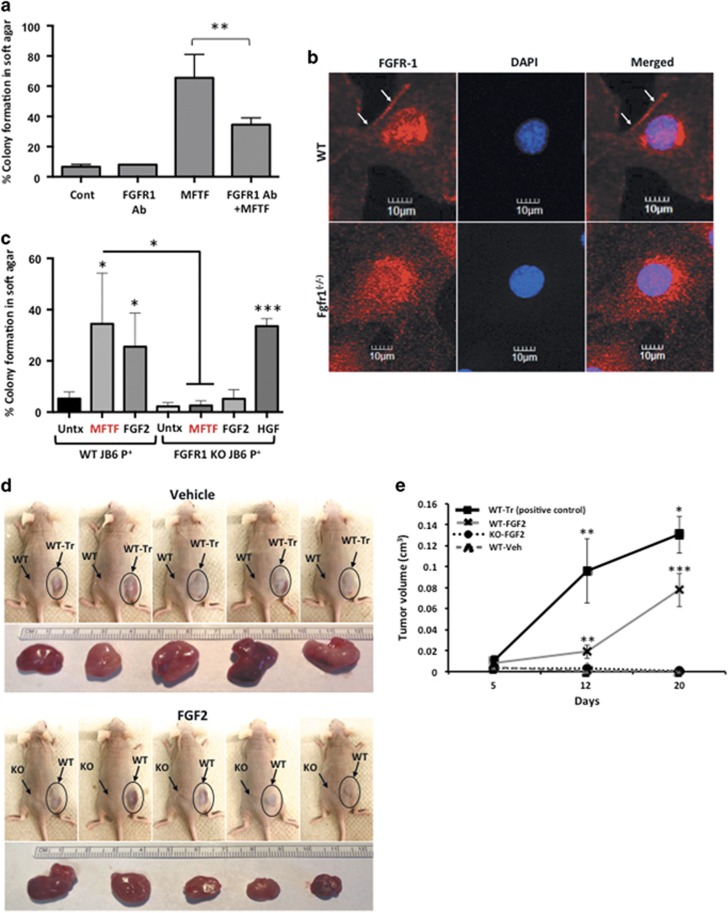
Figure 3.
Knockout of FGFR-1 in JB6 P+ cells inhibits the effect of mouse fat tissue filtrate on transformation in vitro. (a) HFD MFTF-stimulated JB6 P+ cell transformation is partially dependent on FGF2 signaling through the fibroblast growth factor receptor-1 (FGFR-1). Cells were treated with a FGFR-1 neutralizing antibody (Ab) (2 μg/ml) and then treated with MFTF. Growth in soft agar was measured after 14 days. (b) FGFR-1 immunofluorescence (red) in WT JB6 P+ cells and Fgfr-1(−/−) JB6 P+ cells. Specific staining of FGFR-1 is localized to the cell membrane in the WT cells as indicated by white arrows. Membrane FGFR-1 is absent in the KO cells. Images were taken at × 40 magnification. Details of generation of the FGFR-1 KO are in Supplementary Figure 2. (c) JB6 P+ cells deficient in FGFR-1 fail to grow in soft agar above baseline when cultured with FGF2 and MFTF in soft agar. Percentage of clones growing in soft agar (% colony formation) significantly increases in JB6 P+ cells deficient in FGFR-1 cultured with HGF compared no treatment (Untx). (d) Nude mice were subcutaneously inoculated with either WT or FgfR-1 KO JB6 P+ cells. A JB6 P+ transformed clone (WT-Tr) was injected as a positive control. The following day, FGF2 (200 mg/kg) or vehicle was injected i.p. once per day for 7 consecutive days. Photos show s.c. carcinomas induced by FGF2. (e) Growth rates of s.c. tumors formed by WT or FgfR-1(−/−) (KO) JB6 P+ cells injected into nude mice (n=5) that were either injected with saline (vehicle; Veh) or FGF2. A JB6 P+ transformed clone (WT-Tr) was injected as a positive control. The tumor was monitored everyday and tumor volume was recorded on days 5, 12 and 20. Volume of the tumor was calculated using the formula: V=length × width2 × 0.5. Tumors from FGF2-treated mice inoculated with WT cells are compared to tumors from Veh-treated mice inoculated with WT cells (P<0.01 at 12 days and P<0.001 at 20 days), and tumors from Veh-treated mice inoculated with WT-Tr cells (P<0.01 at 12 days and P<0.05 at 20 days). Data are presented as mean±s.d. of values from triplicates and statistical significance was determined using a one-way ANOVA followed by a Tukey’s test for multiple comparisons (a) (*P<0.05, **P<0.001, ***P<0.0001).

