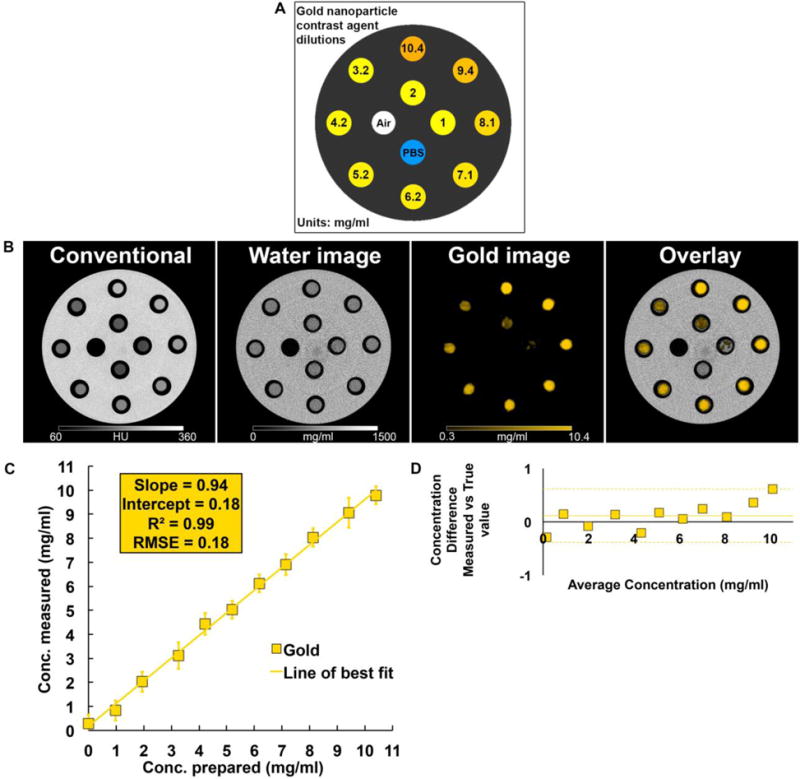
Figure 2.

(A) Diagram of the phantom used. (B) SPCCT derived images (left to right: conventional CT image, water material decomposition, gold image, overlay of gold image on water image). (C) Comparison between the expected and measured concentrations. (D) Bland-Altman plot depicting the comparison of gold content between the prepared and measured concentration as determined by SPCCT image analysis.
