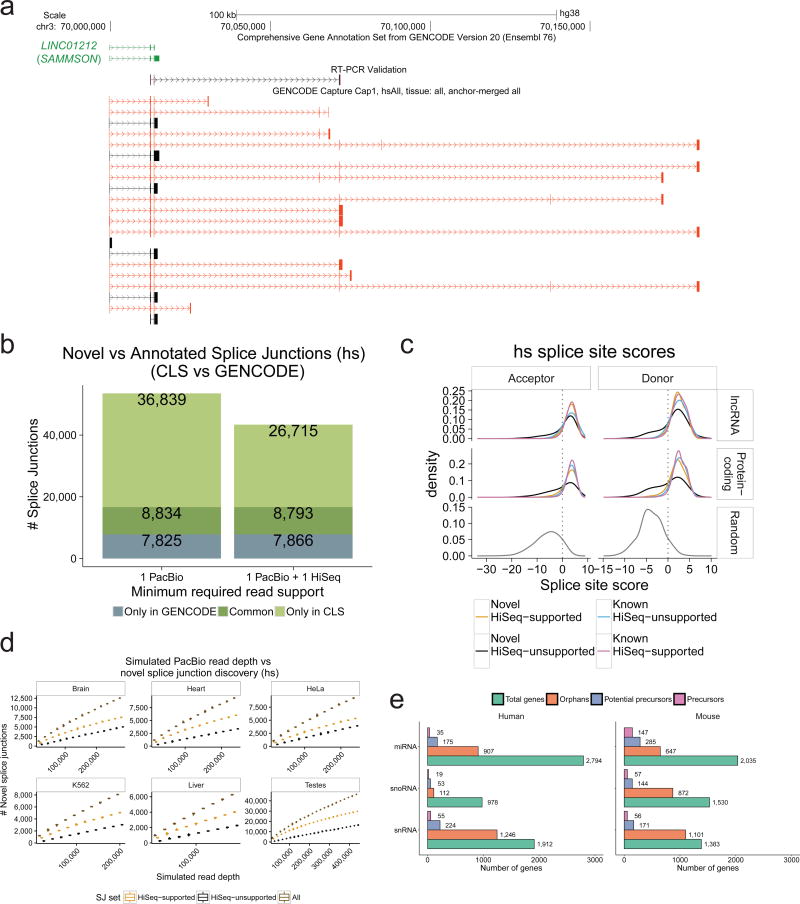
Figure 3. Extending known lncRNA gene structures.
a) Novel transcript structures from the SAMMSON locus. Green: GENCODE; Black/Red: known/novel CLS transcript models (TMs), respectively. An RT-PCR-amplified sequence is shown.
b) Splice junction (SJ) discovery. Y-axis: unique SJs for human (mouse data in Supplementary Figure 6b) within probed lncRNA loci. Grey: GENCODE-annotated, CLS-undetected SJs. Dark green: CLS-detected, GENCODE-annotated SJs. Light green: novel CLS SJs. Left: all SJs; Right: high-confidence, HiSeq-supported SJs. See Supplementary Figure 6c for comparison to the miTranscriptome catalogue.
c) Splice junction (SJ) motif strength. Panels plot the distribution of predicted SJ strength, for splice site (SS) acceptors (left) and donors (right) in human (mouse data in Supplementary Figure 7a). SS strength was computed using GeneID37. Data are shown for non-redundant CLS SJs from targeted lncRNAs (top), protein-coding genes (middle), or randomly-selected SS-like dinucleotides (bottom).
d) Splice junction discovery/saturation analysis in human. Panels show novel SJs discovered (y-axis) in simulations with increasing numbers of randomly sampled CLS ROIs (x-axis). SJs retrieved in each sample were stratified by level of support (Brown: all PacBio SJs; Orange: HiSeq-supported; Black: HiSeq-unsupported). Boxplots summarise 50 samples. Equivalent mouse data in Supplementary Figure 8a, and for novel TM discovery in Supplementary Figure 8b.
e) Identification of putative precursor transcripts of small RNA genes. For each gene biotype, figures show the count of unique genes. “Orphans”: no annotated overlapping transcript in GENCODE, and targeted in capture library. “Potential Precursors”: orphan RNAs residing in the intron of a novel CLS TM. “Precursors”: reside in the exon of a novel transcript.

