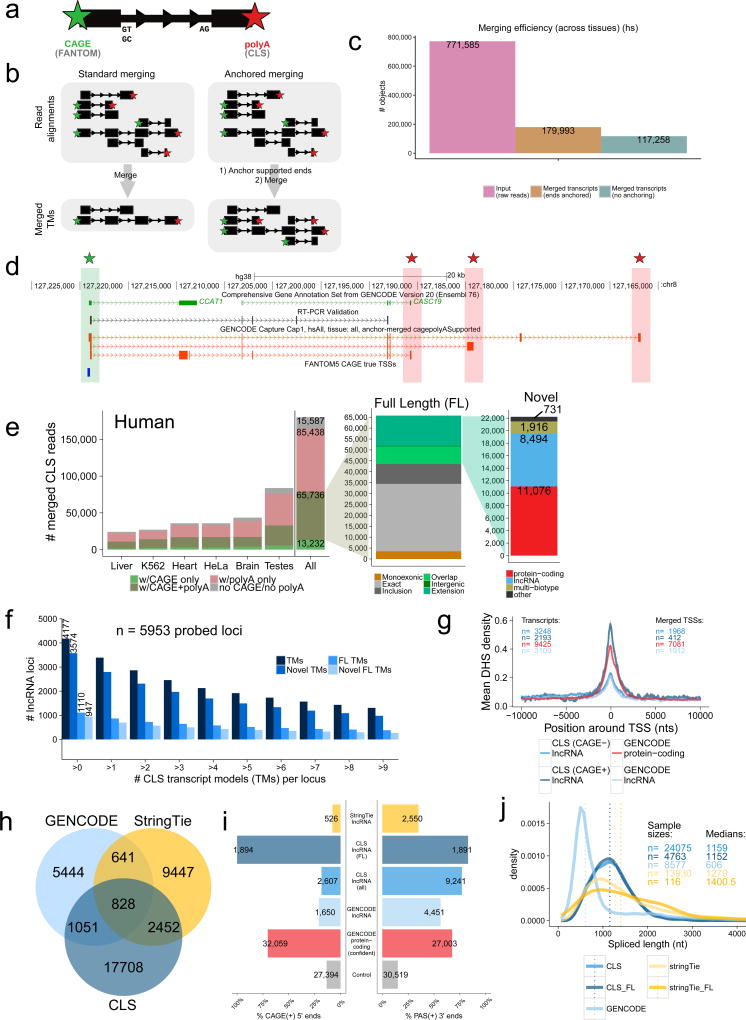
Figure 4. Full-length transcript annotation.
a) 5’ and 3’ termini of transcript models (TMs) are inferred using CAGE clusters and polyA tails in ROIs, respectively.
b) In conventional transcript merging (CM) (left), TSSs and polyA sites overlapping other exons are lost. “Anchored merging” (AM) (right) preserves such sites.
c) AM yields more distinct TMs. y-axis: ROI count (pink), AM-TMs (brown), CM-TMs (turquoise).
d) Full-length (FL) TMs at the CCAT1 / CASC19 locus. Red: novel FL TMs. Green/Red stars: CAGE/polyA-supported ends, respectively. An RT-PCR-amplified sequence is shown.
e) AM-TMs for human (mouse data in Supplementary Figure 11b). y-axis: unique TM counts. Left: All AM-TMs, coloured by end support. Middle: FL TMs, coloured by novelty w.r.t. GENCODE. Green: novel TMs (see Methods for subcategories). Right: Novel FL TMs, coloured by biotype.
f) Numbers of probed lncRNA loci mapped by CLS at increasing cutoffs for each category (human) (mouse data in Supplementary Figure 11c).
g) DHS coverage of TSSs in HeLa-S3. y-axis: mean DHS density per TSS. Grey fringes: S.E.M. “CAGE+” / “CAGE-“: CLS TMs with / without supported 5’ ends, respectively. “GENCODE protein-coding”: TSSs of protein-coding genes.
h) Comparing lncRNA transcript catalogues from GENCODE, CLS, and StringTie within captured regions. Mouse data in Supplementary Figure 12b–e.
i) 5’/3’ transcript completeness, estimated by CAGE and upstream polyadenylation signals (PAS), respectively (human). Shown is the proportion of transcript ends with such support (“CAGE(+)”/”PAS(+)”). “Control”: random sample of internal exons. Mouse data in Supplementary Figure 12f.
j) Spliced length distributions of transcript catalogues. Dotted line: median. Mouse data in Supplementary Figure 12c.

