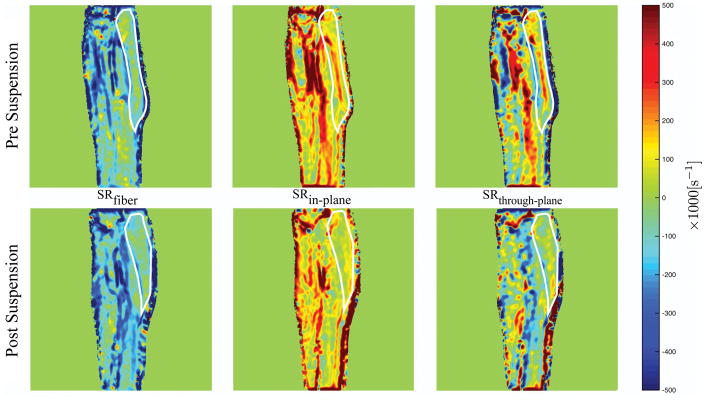
Figure 2.
Eigenvalue colormaps corresponding to one subject at baseline (Pre-suspension) and immediately after the 4 week of unloading (Post-suspension) during isometric contraction at the peak of the contraction phase. Visually, a decrease in SRin-plane and an increase in SRthrough-plane is seen in the post-suspension images compared to the pre-suspension images. The MG is outlined in white for ease of visualization.

