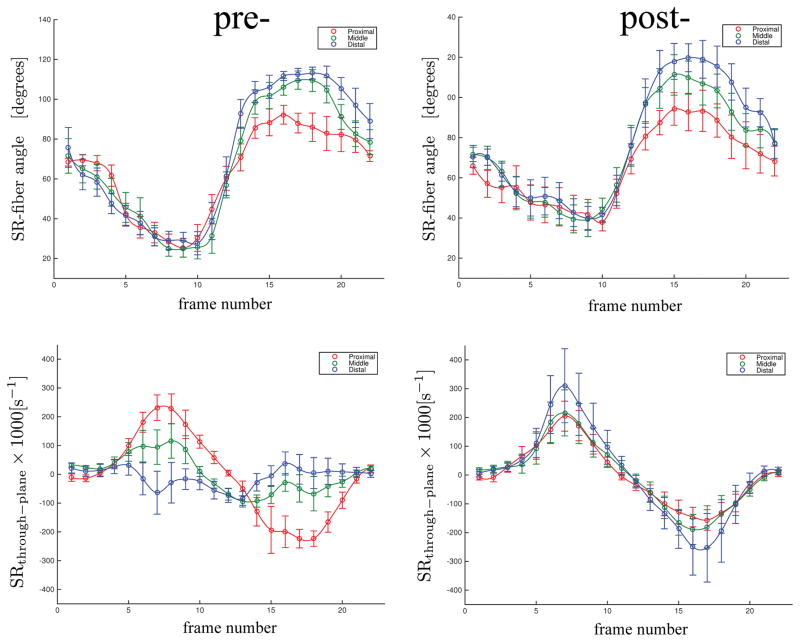
Figure 3.
The temporal variation of the SR-fiber angle and SRthrough-plane with isometric contraction for the pre- and post-suspension cohorts for three regions (proximal, middle, and distal). The values shown in this plot are the average over all subjects of all 7 slices for 3 ROIs (proximal, middle and distal) for the pre-and post-suspension subjects. The jump in the temporal plots of the SR-fiber angle occurs when the negative SR eigenvector direction changes abruptly as the cycle switches to relaxation (from contraction) at phase 11. The SR values are scaled by 1000.

