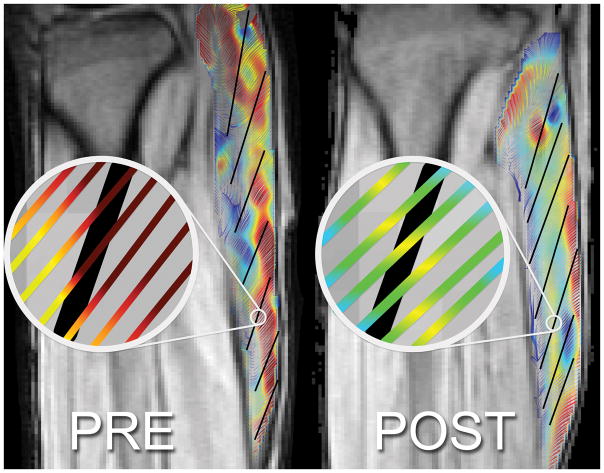
Figure 4.
Streamlines of eigenvectors corresponding to negative eigenvalues overlaid on fiber directions (in black tracked from fascicle orientations) for one slice of the same subject pre- and post-suspension during the contraction phase in the frame corresponding to max value of SRfiber. This shows the difference in angle enclosed by SRfiber and muscle fiber (SR-fiber angle).

