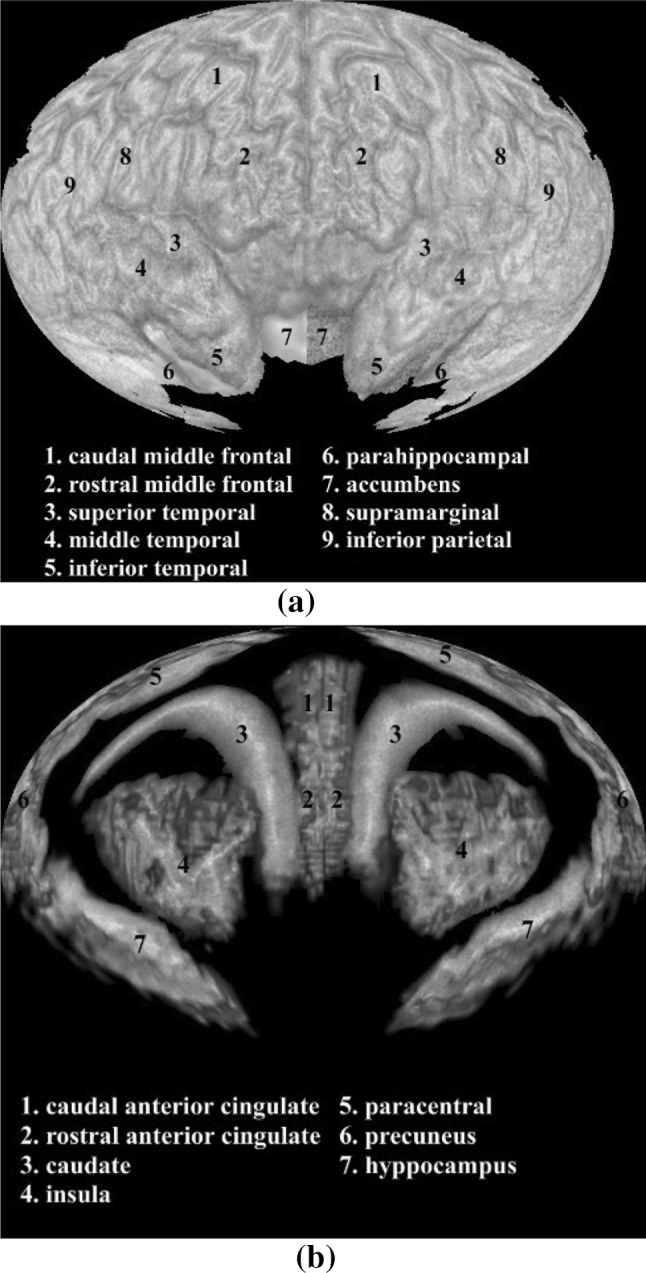
Fig. 13.

Textured brain map for disease classification: a first layer textures, b second layer textures. A noise pattern is applied with three colors representing the three categories (i.e., red for HC, yellow for MCI, and blue for AD). (Color figure online)
