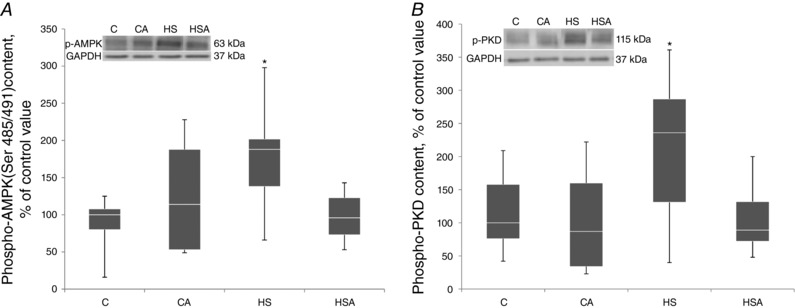
Figure 3. Quantification of p‐AMPK (Ser 485/491) (A) and p‐PKD (B) in the rat soleus expressed relative (%) to control and representative immunoblots for p‐AMPK (Ser 485/491) (A) and p‐PKD (B) and GAPDH (used for normalization).

C, control group; CA, control with AICAR pretreatment; HS, hindlimb suspension for 24 h; HSA, hindlimb suspension for 24 h with AICAR pretreatment. *Significant difference from HS (P < 0.05). Box plots show 25–75 percentiles and median values and the whiskers represent the minimum and the maximum; n = 8/group.
