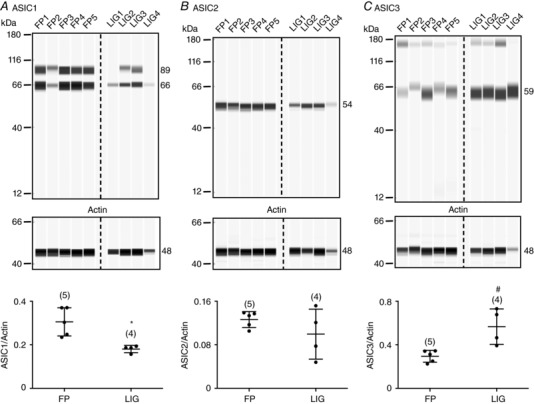
Figure 3. Effect of femoral artery ligation on ASIC1‐3 isoform expression levels.

Western blots for ASIC1 (A), ASIC2 (B) and ASIC3 (C) in DRG tissue isolated from rats that were freely perfused (FP1–FP5) or with ligated femoral arteries (LIG1–LIG4). The 66 and 89 kDa bands in A represent the non‐glycosylated and glycosylated forms of ASIC1, respectively. Each lane (loaded with 0.2 μg μl−1 protein) represents one animal. Actin was used as the loading control. The anti‐ASIC1, anti‐ASIC2, anti‐ASIC3 and anti‐actin antibodies were used at a dilution of 1:100, 1:200, 1:20 and 1:400, respectively. The plots on the bottom show the mean (±SD) values for ASIC/actin ratios for FP and LIG rats. * P = 0.007 and # P = 0.009 for ASIC1 and ASIC3, respectively, employing t tests.
