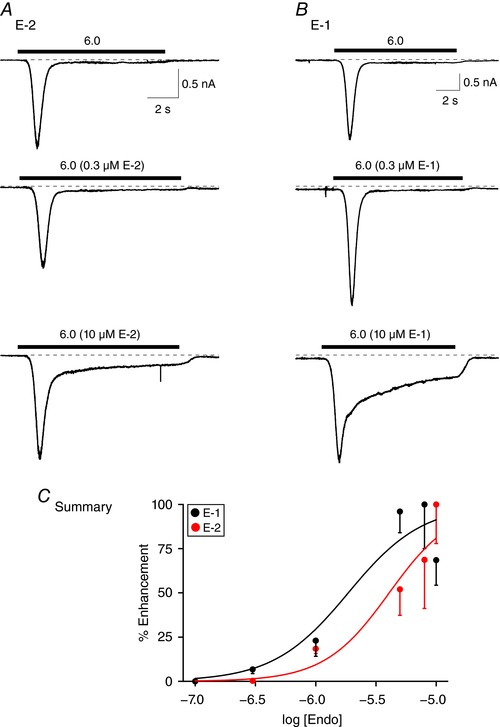
Figure 4. E‐2 and E‐1 concentration‐response relationships in ASIC3‐expressing L‐cells.

ASIC3 current traces obtained before (pH 6.0) and during application of 0.3 and 10 μm E‐2 in the same cell (pH 6.0, A) or E‐1 in the same cell (pH 6.0, B). The cells were pretreated with either E‐2 or E‐1 (pH 7.4) 5 min prior to agonist exposure. C, endomorphin concentration–response relationships for E‐2 (red) and E‐1 (black) peptides. Each point represents the mean (±SEM, n = 3–10 cells) enhancement (%) of the sustained ASIC3 current. The smooth curves were obtained by fitting the points to the Hill equation. [Color figure can be viewed at wileyonlinelibrary.com]
