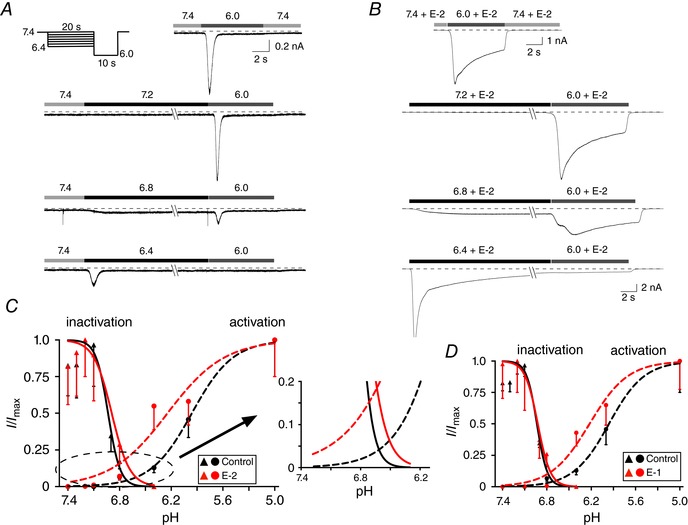
Figure 5. Effect of E‐2 on ASIC3 activation and inactivation curves.

A and B, ASIC3 current traces acquired from a control L‐cell (A) and in the presence of 10 μm E‐2 (B). Activation and inactivation values were obtained by employing the protocol shown in A (top left) with a 20 s condition step between pH 6.4 and 7.4, followed by a 10 s test step to 6.0. The amplitudes of the peak currents from the condition steps were employed for the activation curve and the peak current amplitudes of the test step were used for the inactivation curve (n = 5–16 cells). Activation and inactivation curve points were normalized to pH 5.0 and 7.4, respectively. The smooth curves were obtained by fitting the points to the Hill equation. C, window currents obtained from overlap of activation and inactivation curves before (black) and during (red) E‐2 (10 μm) exposure. The overlapping region has been magnified. D, window currents obtained from overlap of activation and inactivation curves before (black) and during (red) E‐1 (10 μm) exposure. [Color figure can be viewed at wileyonlinelibrary.com]
