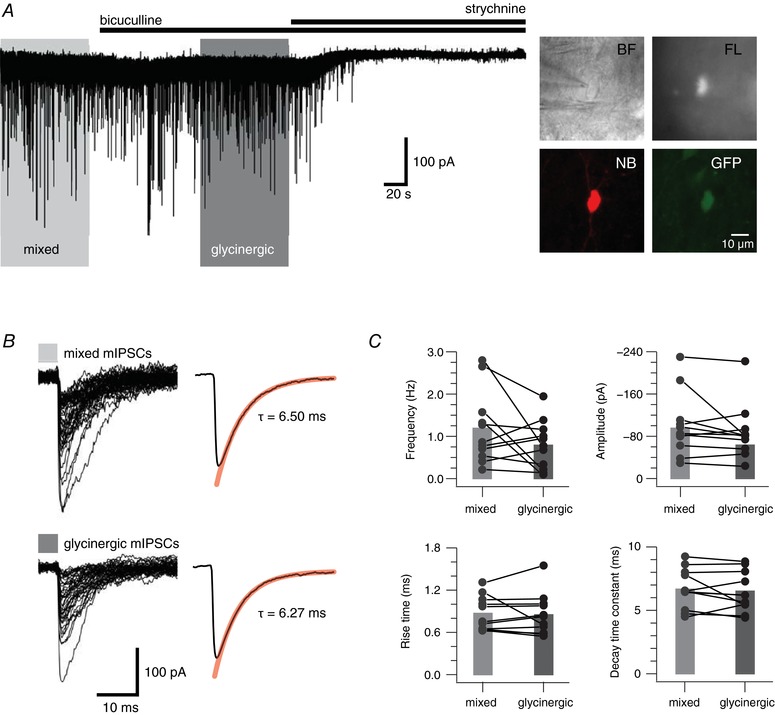
Figure 1. Synaptic inhibition in PV+ INs.

A, trace showing continuous mIPSC recording from a PV+ IN. Mixed mIPSCs were recorded in the presence of CNQX (10 μm) and TTX (1 μm). Glycinergic mIPSCs are revealed following bath addition of the GABAA receptor antagonist bicuculline (10 μm). Bath addition of the glycine receptor antagonist strychnine (1 μm) abolished glycinergic mIPSCs. Inset, neurons were identified in infrared‐differential interference contrast (IR‐DIC) (top left), and fluorescence (top right) was subsequently used to confirm the presence of GFP. In some recordings post hoc recovery confirmed neurobiotin‐filled cells (bottom left) were GFP+ (bottom right). B, left traces show overlaid mixed and glycinergic mIPSCs captured from the recording epochs outlined by the light and dark grey rectangles in A. Right traces show averaged decay waveforms for mixed and glycinergic mIPSCs. Red line shows fit for decay time constant calculation. They were virtually identical for mixed and glycinergic mIPSCs. C, plots comparing mean mIPSC properties (frequency, amplitude, rise time and decay time constant) in PV+ INs under recording conditions that reveal mixed and glycinergic mIPSCs. The majority of recordings showed little change between conditions; however, four recordings showed a reduction in mIPSC frequency when glycinergic mIPSCs were isolated. Most PV+ INs showed little change in mIPSC amplitude, rise time and decay time constant between conditions. [Color figure can be viewed at wileyonlinelibrary.com]
