
Figure 4. PV+ IN excitability is sensitive to levels of glycinergic inhibition.
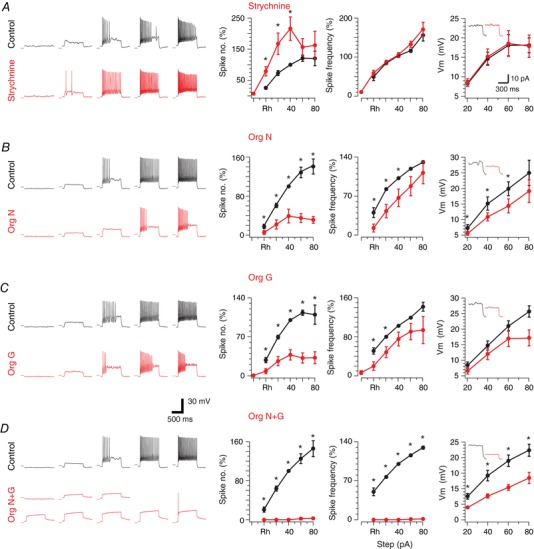
A–D, left traces show action potential (AP) discharge responses of PV+ INs during depolarizing current step injections, before and after manipulation of glycinergic inhibition with strychnine or glycine transporter inhibitors. Right plots show group data summarizing AP discharge and frequency per step above rheobase current, as well as subthreshold current–voltage (I–V) relationships. A, strychnine antagonism of glycine receptors increased AP discharge. This increase is evident in the relationship between AP number versus current step (left); however, AP discharge frequency (middle) was not changed by strychnine. B, traces show AP discharge decreased after GlyT1 blocker Org 24598 exposure. This decrease is clear in the group data plots of AP discharge and frequency per step above rheobase. C, traces show AP discharge decreased after GlyT2 blocker Org 25543 exposure. This decrease is clear in group data plots of AP discharge and frequency per step above rheobase. D, traces show combined GlyT1 and GlyT2 block with Org 24598 and Org 25543 dramatically decreased AP discharge. This dramatic effect is clear in group data plots of AP discharge and frequency per step above rheobase. Insets in I–V plots show example responses to 40 pA depolarizing current steps under control conditions and in the presence of glycine receptor antagonist or inhibitors. [Color figure can be viewed at wileyonlinelibrary.com]