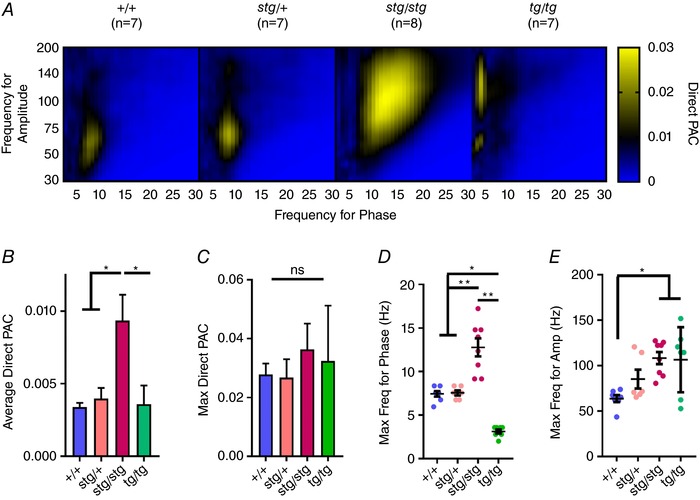
Figure 2. Gene‐specific shifts in the PAC comodulogram.

A, average comodulograms for +/+, stg/+, stg/stg and tg/tg mice reveal distinct abnormal patterns in both homozygous mutants. B, increased average direct PAC in stg/stg mice compared to all other genotypes. C, no significant change in the maximum PAC. D, there is a significant shift to a greater phase frequency in stg/stg and to a lower phase frequency in tg/tg mice. E, there is a significant increase in the amplitude frequency in both stg/stg and tg/tg mice (one‐way ANOVA with multiple comparisons, *adjusted P < 0.05, **adjusted P < 0.005).
