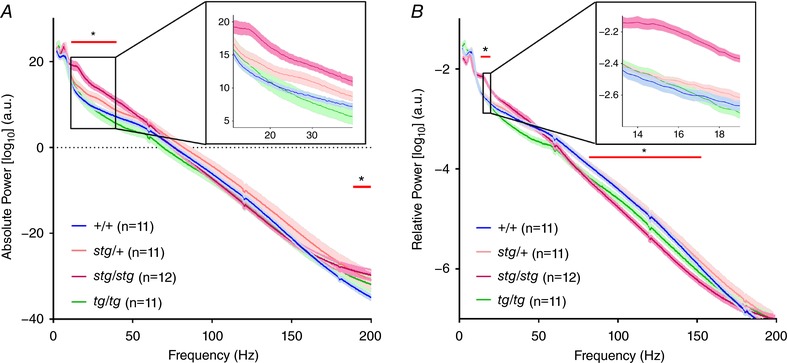
Figure 7. Mean ± SEM EEG power spectra for absolute and relative power.

A, augmented absolute power in stg/stg compared to +/+ mice between 11.25 and 39.5 Hz (inset) as well as 188.25–200 Hz. There is no significant difference in power at any frequency for stg/+ or tg/tg mice. B, augmented relative power between 13.25 and 19 Hz in stg/stg mice compared to +/+ mice with reduced relative power between 81.75 and 152.5 Hz. There is a non‐significant trend toward augmented relative power in the delta range (3–4 Hz) for tg/tg compared to +/+ (two‐way ANOVA with Sidak's correction for multiple comparisons, *adjusted P < 0.05).
