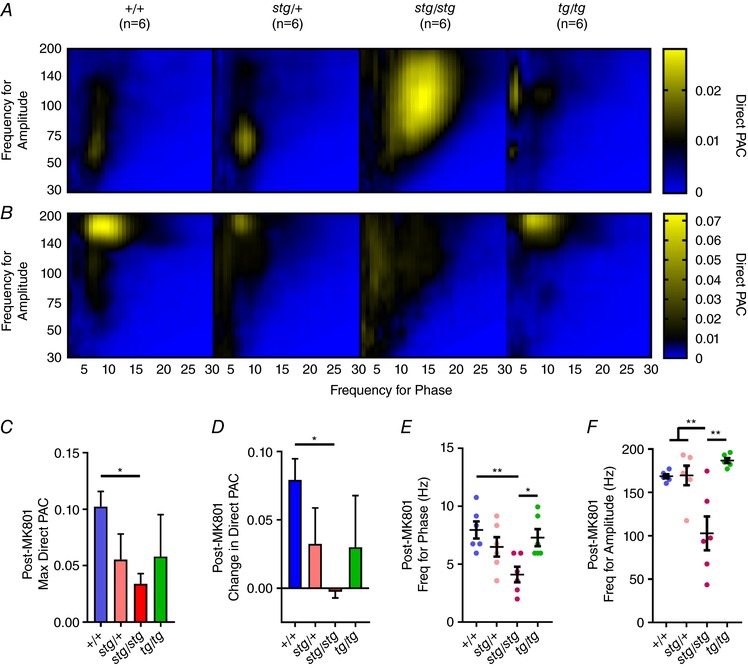
Figure 9. Change in PAC with NMDA receptor blockade.

Compared to PAC before MK‐801 (A), PAC after MK‐801 (B) shifted to theta for phase and high‐gamma for amplitude in all genotypes except for stg/stg mice. Note that the colour map range is adjusted to appreciate changes in comodulogram structure. C, the maximum direct PAC after MK‐801 was significantly greater in +/+ than stg/stg, with intermediate responses in stg/+ and tg/tg. D, similarly, the change in direct PAC was significantly greater in +/+ than in stg/stg mice. E, frequency for phase shifted to delta for stg/stg, significantly lower than theta for phase in +/+ and tg/tg, and (F) frequency for amplitude for stg/stg was significantly lower than all other genotypes post‐MK801 (n = 6 in each group, one‐way ANOVA with Tukey's correction for multiple comparisons; *adjusted P < 0.05, **adjusted P < 0.01, **adjusted P < 0.0005).
