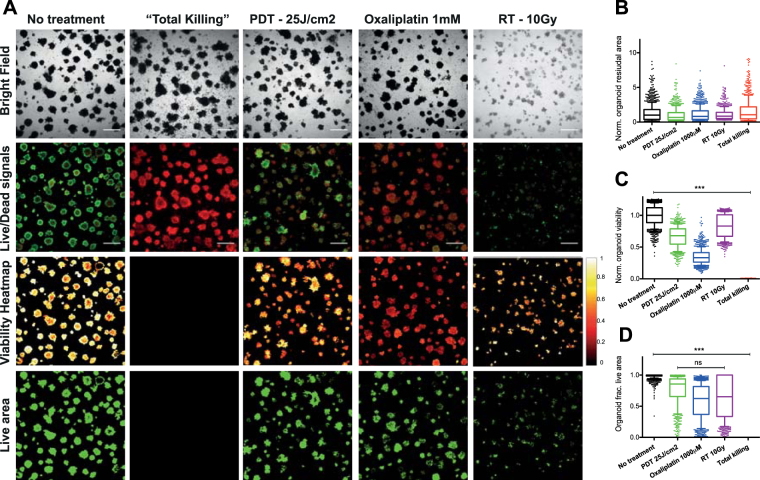
Figure 3.
Treatment outcomes of PDAC 3D models grown as adherent monocultures (MIA-PaCa2) subjected to PDT (25 J/cm2), oxaliplatin chemotherapy (1 mM) and radiotherapy (10 Gy). (A) Brightfield and live/dead fluorescence images, obtained using a confocal microscope, as well as viability heatmaps and live area maps derived from subsequent CALYPSO analysis are given for each group. (B) Boxplot depicting the spread in normalized organoid total areas as quantified from the brightfield images depicted in panel A. (C) Boxplot depicting the spread in viability of every individual organoid within the treatment and control groups. (D) Boxplot depicting the spread in fractional live area of every individual organoid within the treatment and control groups. All boxplots depict median, 25th and 75th percentile, and the 90% confidence interval.

