Figure 4.
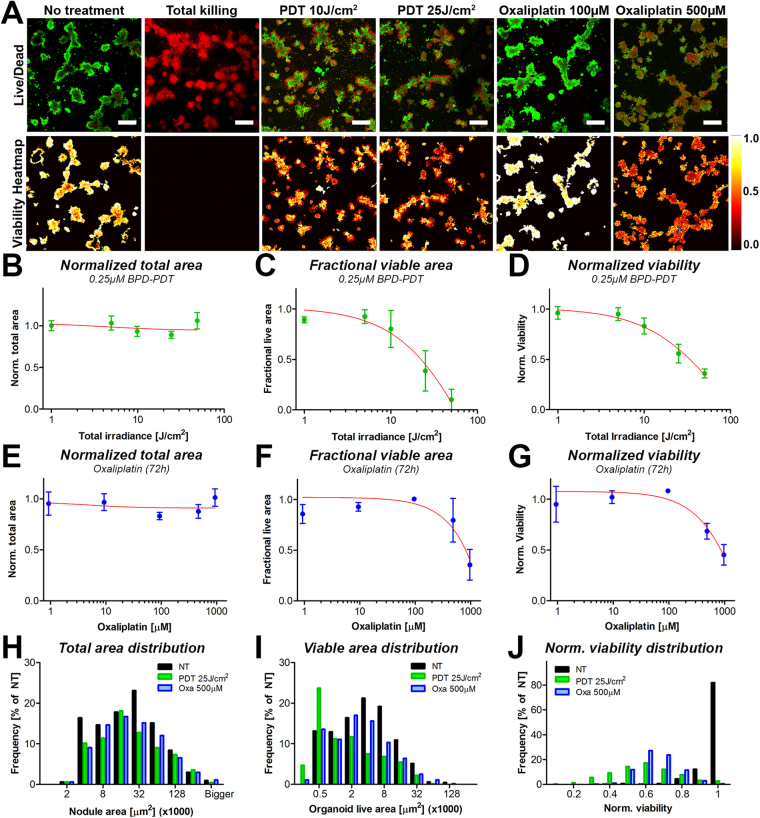
Primary output parameters obtained through CALYPSO, including viability heatmaps as well as normalized total area, fractional live area and normalized viability, demonstrate the ability to report treatment response dynamics on spheroid and non-spheroid organoids of MIA PaCa-2 cells grown with primary dermal fibroblasts following treatment with PDT and oxaliplatin chemotherapy. (A) Live/dead images of calcein and PI fluorescence were superimposed in ImageJ and depicted side-by-side with the corresponding viability heatmaps, providing spatial information on the viability distributions throughout the tumor nodules. Depicted are untreated adherent cocultures of MIA PaCa-2 cells and primary dermal fibroblasts, either untreated or treated with 25 J/cm2 BPD-PDT or 1 mM oxaliplatin (72 h). Dose response correlations between the PDT radiant exposure and the (B) median total area (mean ± SEM), (C) median fractional live area (mean ± st. dev.), and (D) the median viability of the tumor organoids (mean ± st. dev.). Data represents the mean of the median value per image (N = 12–24). (E–G) Distributions of residual total area (E), fractional live area (F) and viability (G) of the individual tumor organoids following treatment with BPD-PDT at a radiant exposure of 25 J/cm2 (green bars) or 500 μM oxaliplatin (blue bars) in comparison to the no treatment control group (black bars).

