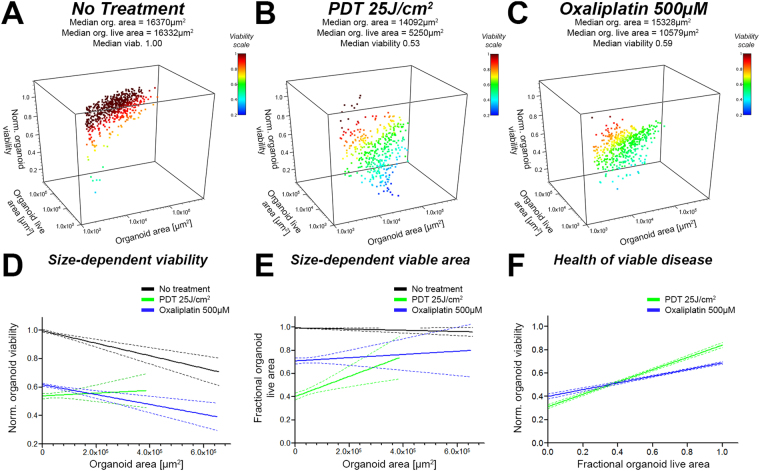
Figure 5.
Readouts from CALYPSO are paired and allow advanced analysis of treatment response to investigate correlations between total residual area, residual viable area, and viability for every individual tumor organoid. Depicted here are results obtained on organoids made of MIA PaCa-2 cocultured with human dermal fibroblasts. Organoids were either untreated (black) or treated with either PDT at a radiant exposure of 25 J/cm2 (green) or 500 µM oxaliplatin (blue). Panels A, B and C represent 3D scatter plots of the paired data (organoid total area, organoid live are and viability) measured on cultures from (A) the no treatment control group, (B) the PDT (25 J/cm2) group, and (C) the 500 μM oxaliplatin group (72 h). Panels D, E and F represent linear regression performed on series of paired data allowing a deeper comparison of the effect of PDT and oxaliplatin chemotherapy regarding the no treatment control group. (D) Linear regression analysis between organoid viability and organoid size (area), displaying that PDT is more efficient in eradicating smaller organoids, whereas no size-related effects regarding viability are observed for oxaliplatin chemotherapy. (E) Linear regression analysis between fractional organoid live area and total organoid area, demonstrating that PDT reduces the relative live area more effectively for smaller organoids compared to larger organoids. (F) Linear regression analysis between organoid viability and fractional live area, demonstrating that PDT treatment leaves behind large viable nodules with high viability and small viable nodules with low viability. A similar trend was observed for oxaliplatin chemotherapy, although the steepness of the correlation suggests a much more homogeneous dispersion of viability and viable organoid size.

