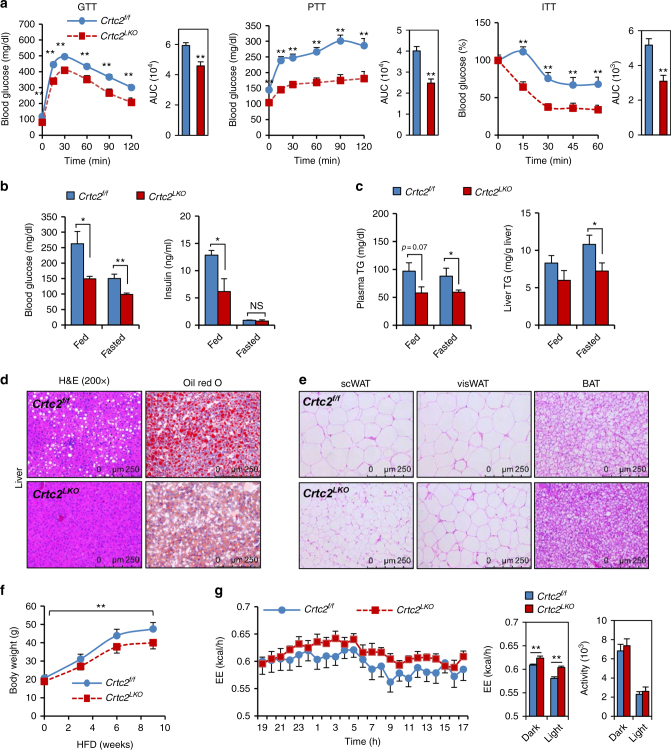
Fig. 1.
Hepatic Crtc2 controls systemic glucose and lipid metabolism in mammals. a Glucose tolerance test (GTT, left), pyruvate tolerance test (PTT, middle), and insulin tolerance test (ITT, right) showing effects of chronic depletion of hepatic Crtc2 in mice under HFD for 8 weeks on glucose metabolism and insulin signaling (n = 13 for Crtc2 f/f mice and n = 11 for Crtc2 LKO mice). Area under the curve (AUC) for each test was also shown. b Ad libitum (fed) or 16 h-fasting (fasted) blood glucose levels (left), and ad libitum (fed) or 16 h-fasting (fasted) insulin levels (right) from either Crtc2 f/f mice or Crtc2 LKO mice under HFD for 9 weeks (n = 13 for Crtc2 f/f mice and n = 11 for Crtc2 LKO mice). c Plasma triglycerides (TG) levels (left) and hepatic TG levels (right) from either Crtc2 f/f mice or Crtc2 LKO mice under ad libitum (fed) or 16 h-fasting (fasted) conditions under HFD for 9 weeks (n = 13 for Crtc2 f/f mice and n = 11 for Crtc2 LKO mice). d Paraffin-embedded sections of liver tissues from 8-week HFD-fed mice were stained with hematoxylin and eosin (H&E, left). Frozen liver sections were also stained with oil red O (right). Data represent three independent experiments (n = 3 mice per group). e Paraffin-embedded sections of subcutaneous white adipose tissues (scWAT, left), visceral white adipose tissues (visWAT, middle), and brown adipose tissues (BAT, right) from 16 h-fasted, 9-week HFD-fed Crtc2 f/f mice or Crtc2 LKO mice were stained with H&E. Data represent three independent experiments (n = 3 mice per group). f Body weight from either Crtc2 f/f mice or Crtc2 LKO mice under HFD (n = 13 for Crtc2 f/f mice and n = 11 for Crtc2 LKO mice). g Energy expenditure (top and bottom left for quantitation) and locomotor activity (bottom right) were measured from 7-week HFD-fed Crtc2 f/f mice or Crtc2 LKO mice by using metabolic cage (n = 10 for Crtc2 f/f mice and n = 9 for Crtc2 LKO mice). Note that the HFD was initiated at 4 weeks of age and maintained throughout the experimental period. Data in a, b, c, f and g represent mean ± s.e.m. (*P < 0.05, **P < 0.01, t-test a–c and g or Tukey–Kramer multiple comparisons f)

