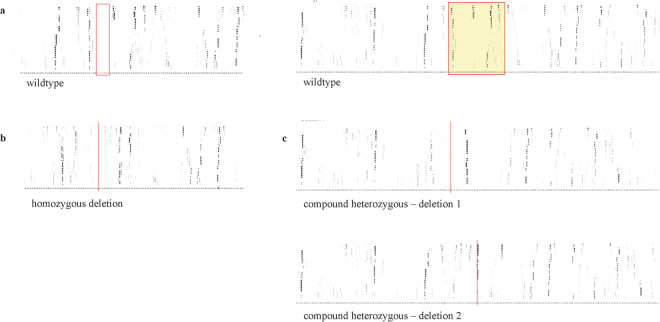
Figure 5.
Local structures in the targeted region of TUNA are altered after genome-editing. Using RNAplfold, local averaged pair probabilities are computed and represented in a dot plot33. (a) Wildtype local RNA structure of TUNA (left red box: position of homozygous deletion; right red box: position of the compound heterozygous deletions). (b) and (c) respectively show the local RNA structure of TUNA in the colony with the homozygous deletion and in the colony with the compound heterozygous deletions after CRISPR/Cas9 editing. The red lines indicate the position of the deletions.

