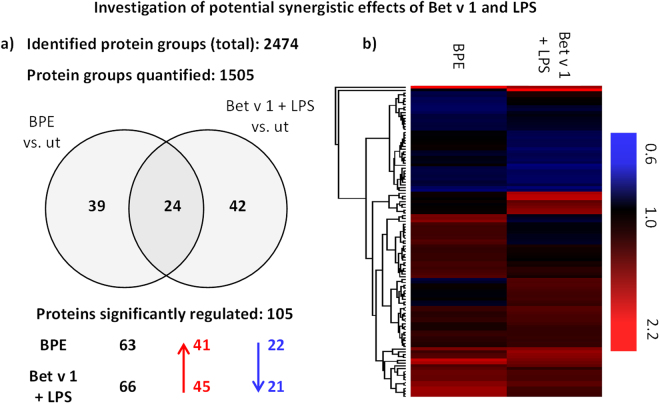
Figure 5.
Quantified protein groups and significantly regulated proteins after treatment with BPE or Bet v 1 and LPS. (a) In total, 2474 protein groups were identified in moDCs obtained from 4 individual donors. 1505 protein groups were quantified. The Venn-diagram shows the overlap of significantly regulated protein groups (treated vs. untreated, “ut”) after the treatments. Proteins were considered to be significantly regulated if averaged and normalised ratios were greater or less than two times the standard deviation. (b) Hierarchical clustering based on Euclidian distance of 105 significantly regulated proteins after treatment of moDCs with BPE or Bet v 1 in combination with LPS. Shown are TMTsixplex™ ratios (treated vs. untreated, “ut”). Blue indicates downregulation, red highlights upregulation. The entire list of regulated proteins can be found in the supplementary excel file 2.

