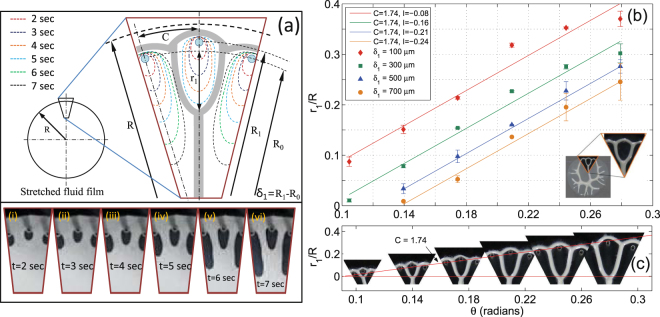
Figure 3.
Single finger-finger interaction. (a) Schematic diagram showing initiation and progression of two outer and one central finger from source-holes placed at a raduis of R 0 and R 1 respectively, where R 0 < R 1. Images i–vi are frames taken from a video-record of actual experiment showing the controlled non-uniform interaction. Corresponding to six stages (image i–vi) of the process, schematic diagram also represents six interface evolution stages. At time t = 4 sec all the fingers have grown to almost equal lengths (orange line) however outer fingers are ahead of central one as they had initiated from source-holes closer to the cell center (R 0). At time t > 4 outer fingers grow faster in size as they over-taken the central finger, getting more area to spread out, eventually shielding the center finger to a limited size. Fluid left between the fingers is shaped into long branches with a merging point (node) at the tip of central finger. Fluid, which had initially spread beyond the source-holes recollects itself into a circumferential branch. (b) The figure shows that with increase in θ, r 1 increases linearly with constant slope of 1.74 for all . Also as delta increases r 1 decreases for the same θ. (c) Pictorial representation, from actual structures fabricated, of variation in r 1/R against θ. Shapes formed here are form a Hele-Shaw cell with b 0 = 50 μm, R 0 = 15 mm, θ = 10° and δ 1 = 100 μm.

