Fig. 2.
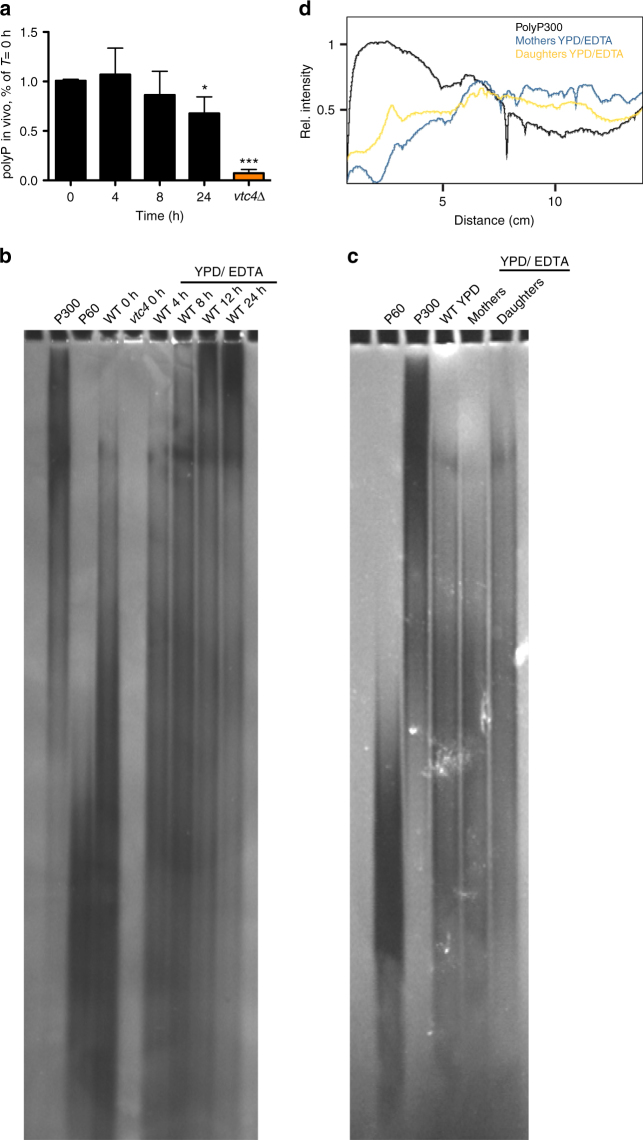
Amounts and chain length of polyP on YPD/EDTA. a PolyP content in wild-type cells on YPD/EDTA. Cells were grown on YPD/EDTA for the indicated periods of time, collected, and polyP content was assayed. Results represent mean ± SD of three independent experiments. Statistical differences were determined using Student’s t test comparing polyP levels from T = 0 h with the later time points and the vtc4Δ strain; *p ≤ 0.05; ***p ≤ 0.001. b Chain length. PolyP was extracted from cells growing on YPD/EDTA for the indicated periods of time. PolyP was purified from cells by glass bead rupture and phenol/chloroform extraction. Samples were treated with RNAse A and proteinase K before 30 nmol of polyP were resolved on a 15% polyacrylamide gel, followed by negative staining with DAPI. c Mother (m) and daughter (d) fractions were separated after 16 h of growth on YPD/EDTA. PolyP was extracted from cells as in (b), resolved on a 20% polyacrylamide gel and stained with DAPI. PolyP isolated from a non-separated population of wild-type cells growing logarithmically on YPD is shown for comparison. d The signal intensity in the lanes with mother and daughter samples from (c) was quantified using ImageJ, starting at the top of the gel. The profile for polyP300 was included for comparison

