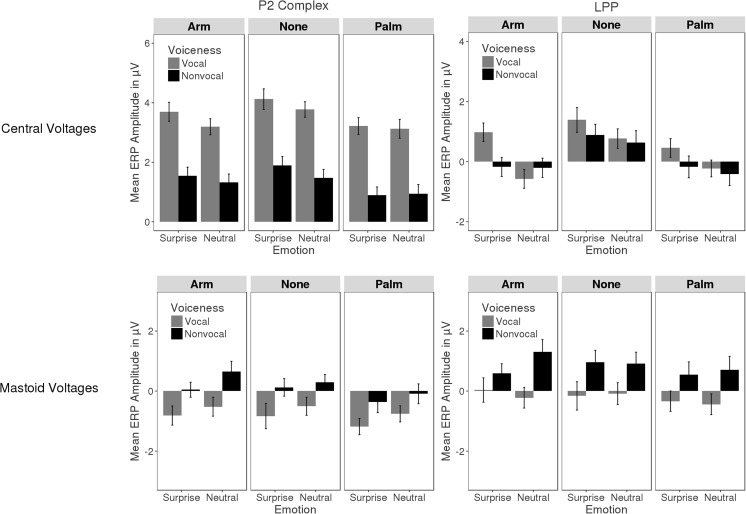
Fig. 4.
Bar graph of P2 (left) and LPP (right) mean voltages for the different experimental conditions computed across the left and right central region (top row) and the mastoids (bottom). Voiceness effects are most evident in the P2 with greater amplitude for vocal as compared with nonvocal sounds over central and the opposite over mastoid electrodes. Touch effects are most evident in the LPP where they interact with voiceness and emotion. Error bars reflect the 95% confidence interval

