Figure 1.
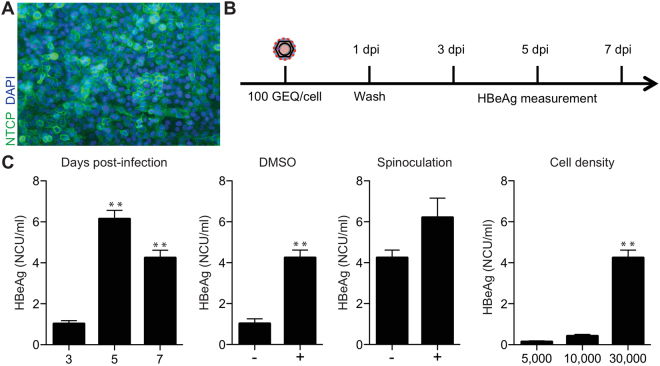
HBV infection and optimization in HepG2-NTCP cells. (A) Immunofluorescence microscopy to detect NTCP in HepG2-NTCP. (B) Schematic of the experimental design. (C) Optimization of HBV infection in HepG2-NTCP cells. Cells were infected with 100 GEQ/cell and the following conditions were optimized by measuring HBeAg in cell supernatants by ELISA X days post infection: duration of infection, DMSO treatment, spinoculation, and seeding cell density (96-well plate). In all conditions, 4% PEG was present in the inoculum, then washed out one day post-infection. At least three biological replicates were performed and data are shown as means ± s.d. (one-way ANOVA for days post-infection and cell density, two-tailed unpaired t test for DMSO and spinoculation, **P < 0.001).

