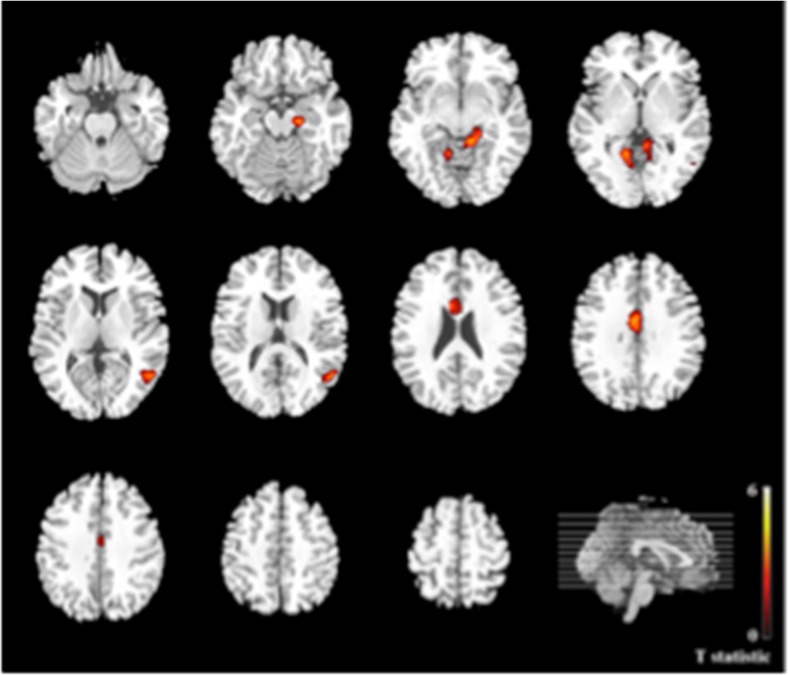
Fig. 2.
Whole-brain between-group activation differences for negative > neutral faces covaried with sleep amount; Anxious Adolescents > Healthy Adolescents × Sleep Amount. Axial brain slices depicting whole-brain activation differences between anxious adolescents relative to healthy adolescents. The right side of the image corresponds to the right side of the brain, p < .05, corrected. (Color figure online). Anxious Adolescents > Healthy Adolescents × Sleep Amount

