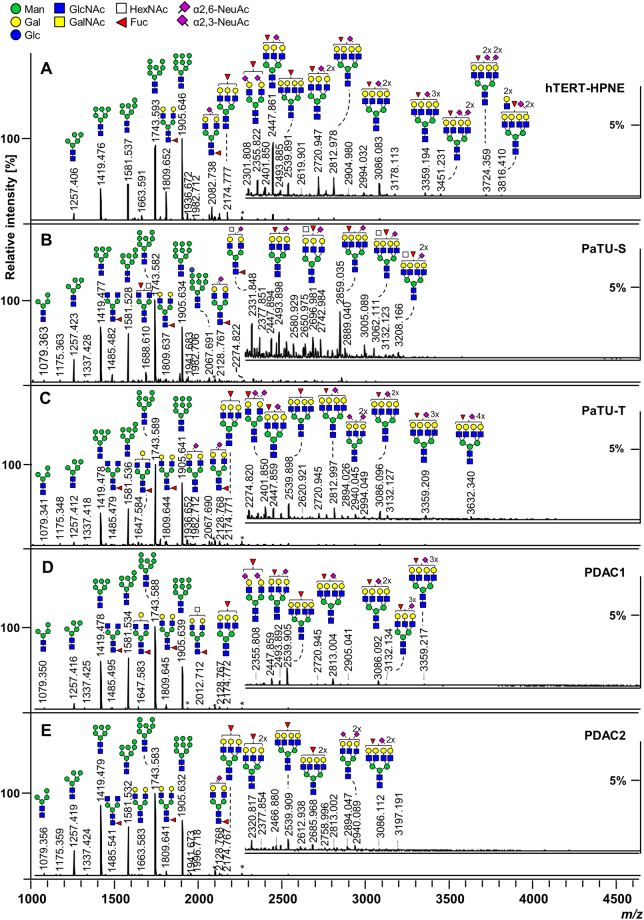
Figure 1.
Representative positive ion mode MALDI-TOF-MS spectra of released and derivatized N-glycans. Exemplary mass spectra of (A) Pancreatic duct cell line hTERT-HPNE, (B) Pancreatic duct adenocarcinoma (PDAC) sister cell lines PaTu-S and (C) PaTu-T, as well as the primary PDAC cell cultures (D) PDAC1, and (E) PDAC2 are shown. Major glycan peaks are annotated. Symbolic glycan depictions represent compositions and the presence of structural isomers cannot be excluded. Glc = glucose; Gal = galactose; Man = mannose; GlcNAc = N-acetylglucosamine; GalNAc = N-acetylgalactosamine; Fuc = deoxyhexose, fucose; NeuAc = N-acetylneuraminic acid; *reducing end adduct.

