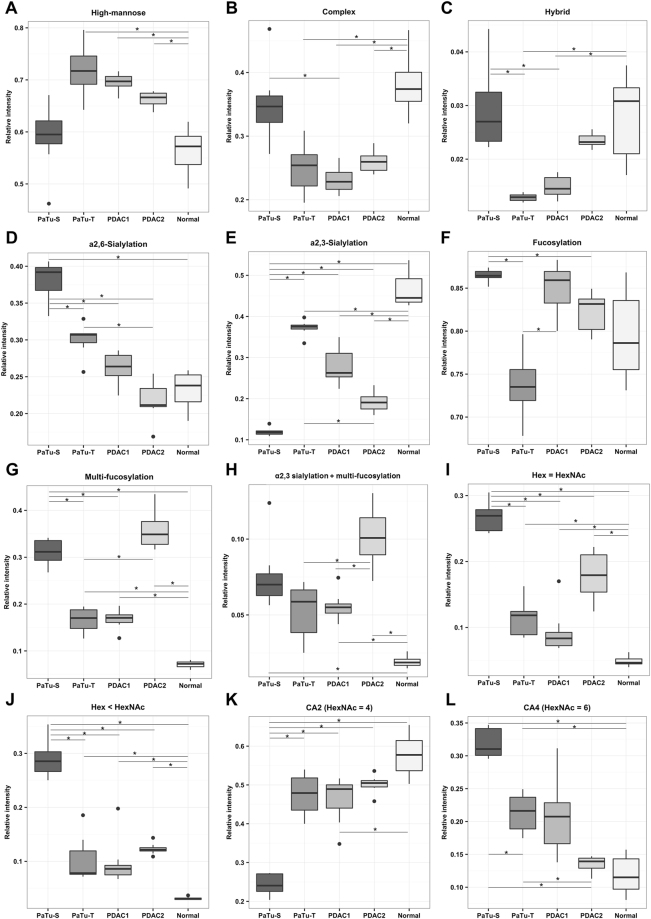
Figure 3.
Analysis of structural N-glycan classes. Derived traits were calculated and averaged per cell line for the biological replicates from mass spectrometry analysis. Boxplots are illustrated with median and interquartile range. (A) Total high-mannose type content, (B) Total complex-type N-glycans, (C) Total hybrid type structures. Following derived traits were calculated including exclusively N-glycans of the complex type: (D) α2,6-Sialylation, (E) α2,3-Sialylation, (F) Fucosylation, (G) Multi-fucosylation defined as the presence of more than one fucose, representative for antenna-fucosylation, (H) Multi-fucosylation of α2,3-sialylated N-glycans, indicative for sialyl Lewis antigens, (I) N-glycans featuring an equal number of N-acetylhexosamines (HexNAc) compared to hexoses (Hex), (J) N-glycans featuring smaller number of Hex than HexNAc, (K) N-glycans with HexNAc = 4, indicative for di-antennary N-glycans, (L) N-glycans with HexNAc = 6, indicative for tetra-antennary N-glycans as well as LacNAc-repeats, bisecting GlcNAc, or GalNAcs additions. Traits were tested for significant differences between the samples and p-values are given in Supplemental Table S7.

