
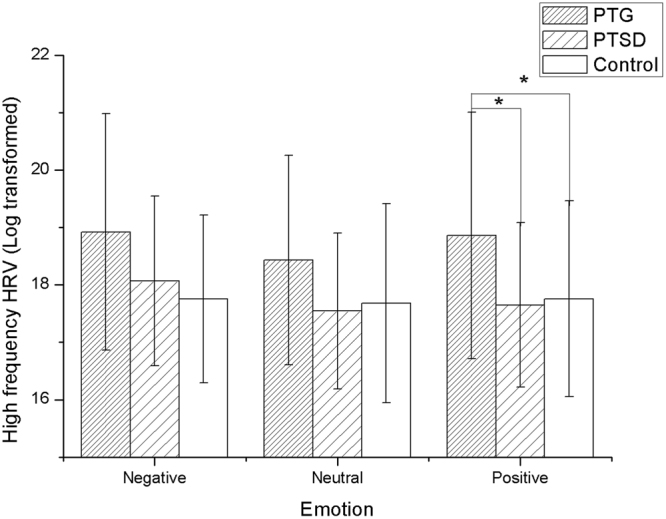
Figure 4.
Significant group differences in the negative and positive affective pictures stimulating between the control group and the PTG group in the high frequency HRV, which showed that the PTG group had higher high frequency HRV *p < 0.05.
Official websites use .gov
A
.gov website belongs to an official
government organization in the United States.
Secure .gov websites use HTTPS
A lock (
) or https:// means you've safely
connected to the .gov website. Share sensitive
information only on official, secure websites.
Significant group differences in the negative and positive affective pictures stimulating between the control group and the PTG group in the high frequency HRV, which showed that the PTG group had higher high frequency HRV *p < 0.05.