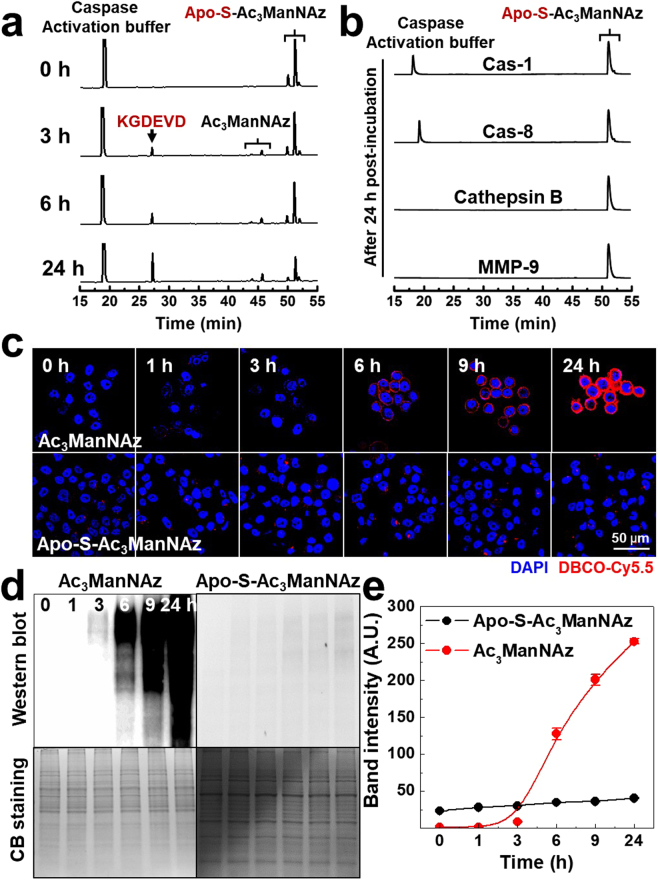
Figure 2.
(a) In vitro cleavage of Apo-S-Ac3ManNAz was monitored using HPLC system at 0, 3, 6, and 24 h post-incubation with Cas-3 (15 μg/ml). (b) As a control experiment, Apo-S-Ac3ManNAz was also monitored using HPLC system at 24 h post-incubation with 15 μg/ml of Cas-1, Cas-8, Cathepsin B and MMP-9, respectively. The generation of azido groups on the surface of non-apoptotic PC-3 tumor cells in vitro. (c) Time-dependent CLSM images of Ac3ManNAz (20 μM) or Apo-S-Ac3ManNAz (20 μM)-treated PC-3 tumor cells, followed by DBCO-Cy5.5 (200 nM) to visualize azido groups on the cell surface. Red = DBCO-Cy5.5 channel; Blue = DAPI channel. (d) Western blot analysis of azido groups (N3) containing glycoproteins in cell lysates. The coomassie blue (CB) stain shows the total amount of glycoproteins in cell lysates. (e) Quantification of band intensity of azido groups of Western blot data using ImageJ software.

