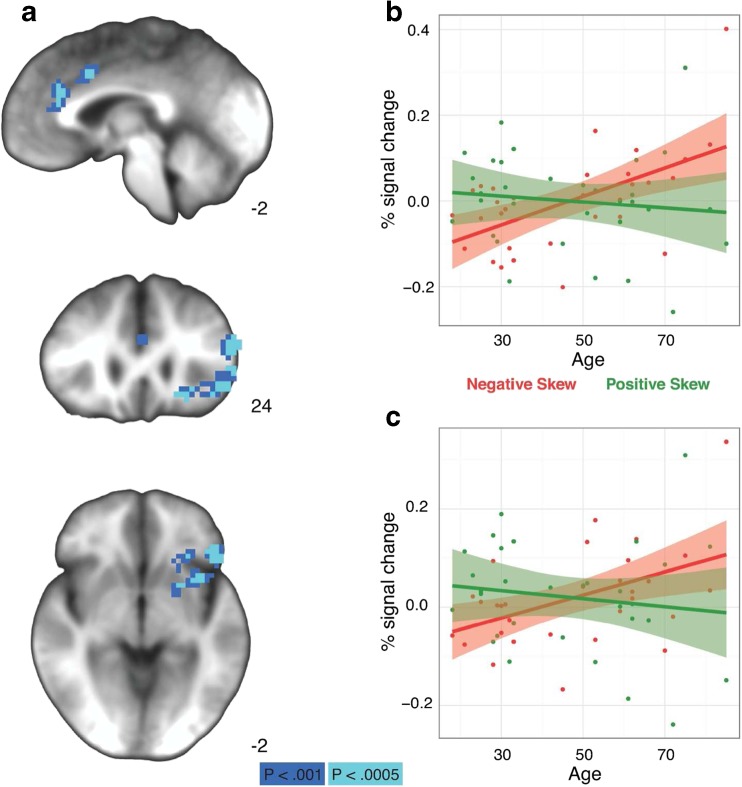
Fig. 2.
Neural age by valence interaction during skewed gambling task. Top: Right anterior cingulate. Bottom: Left inferior/middle frontal gyrus. Middle: Both regions. a Clusters where there was a significant Age × Valence interaction (Left=right). b–c Percentage signal change in each region over age (in years) split by positive and negative skew trials. (Color figure online)

