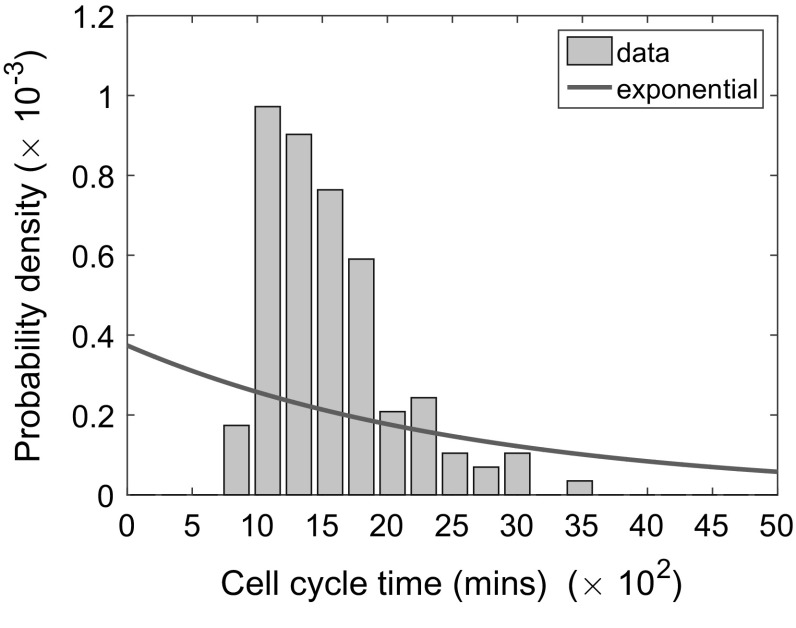
Fig. 1.
(Color figure online) The poor agreement between the best-fit exponential distribution (red curve) and experimentally determined cell cycle times in NIH 3T3 mouse embryonic fibroblasts grown in vitro (grey histograms). The rate parameter of the exponential distribution was fitted by minimising the sum of squared residuals between the curve and the bars of the histogram

