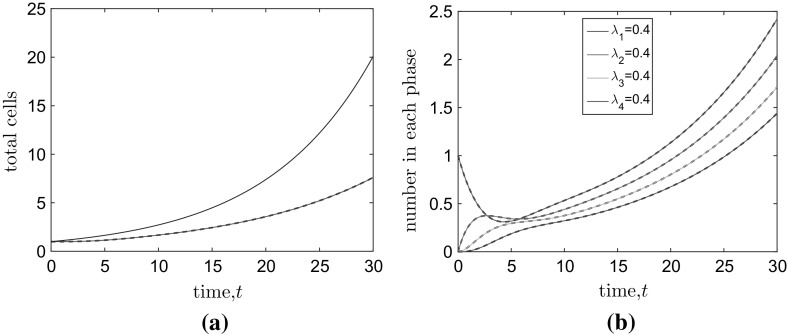
Fig. 3.
(Color figure online) The evolution of the of a the total numbers of cells and b the mean numbers of cells in each of stages. In a, we plot the numerical (red line) and analytical (dashed black line) solutions for the total mean number of cells in the case and according to the naive () cell cycle model [analytical solution of Eq. (7)—blue line]. In b analytically determined solutions [see Eqs. (12)–(15)] are plotted as dashed black lines and their numerical counterparts on top as solid coloured lines. The average CCT is arbitrary time units. The average period of each stage is equal ( for )

