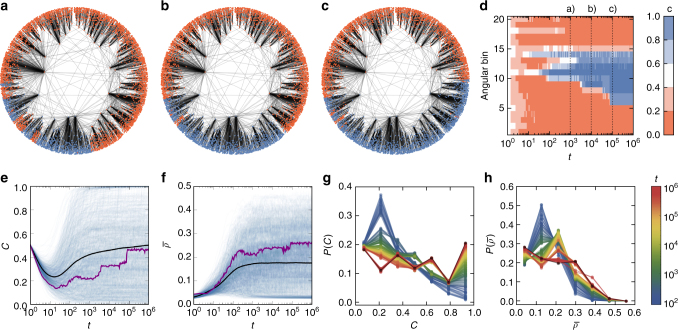
Fig. 2.
Spatial patterns in evolutionary games. a–c Evolution of the system (see also Supplementary Movie 1) for a single realization of the prisoner’s dilemma (T = 1.2 and S = −0.2). Here we have generated a synthetic network with N = 5000 nodes, power law exponent γ = 2.8, and mean local clustering . Cooperators are marked in blue, whereas red denotes defectors. The system was started with randomly selected cooperators (c(0) = 0.5). a shows the state of the system after 103, b after 104, and c after 105 generations. d Density of cooperators (color coded) in different angular bins (shown on the y axis) as a function of time (shown on the x axis). Here we have divided the angular space θ ∈ [0, 2π) into 20 equidistant bins. e–h Results for the same synthetic networks as before but with N = 2 × 10⁴ nodes. e Evolution of the density of cooperation C for 103 independent realizations of the system (blue lines) and their average (black line). The purple line corresponds to the realization shown in a–c. f Evolution of the KS-statistics for 103 independent realizations of the system (blue lines) and their average (black line). The purple line corresponds to the realization shown in a–c. g Evolution of the distribution of cooperation C observed in the system. Each color represents the histogram of cooperation among different realizations of the system at time t, where the color denotes the time (see legend in plot h). The 7 points hence represent 7 bins. The x-axis denotes the cooperation density C and the y-axis shows the probability P(C) that in one realization of the system the density of cooperation at time t is C. h Evolution of the distribution of observed in the system (colors denote time)

