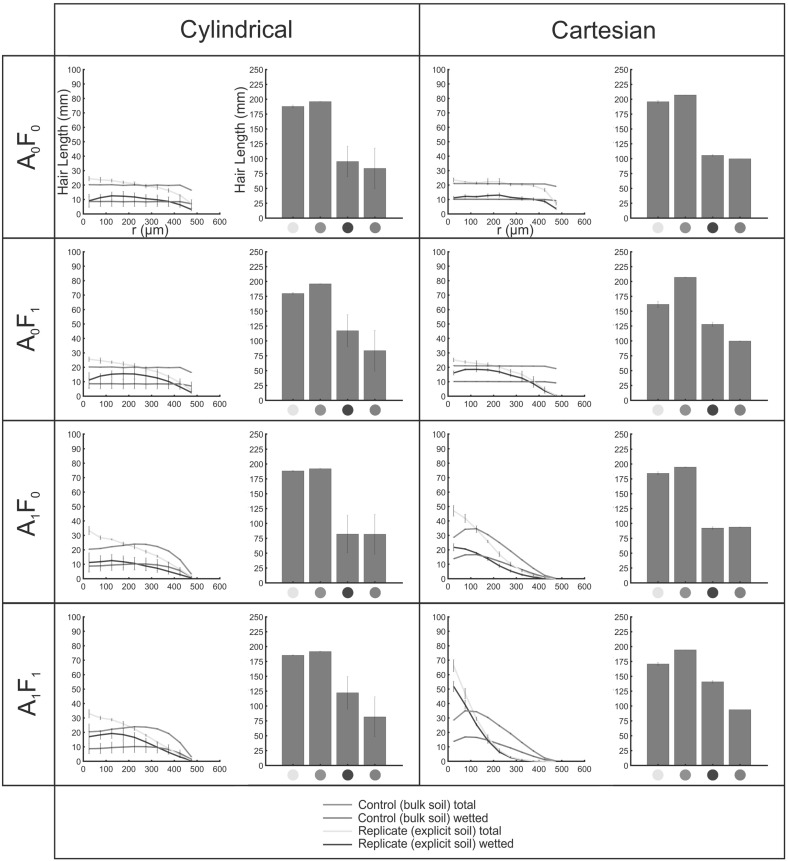
Fig. 11.
(Color figure online) Hair length density profiles with distance (r) from the initiating surface, and bar charts of total integrated hair length, for each growth condition, averaged over all cylindrical and Cartesian SRXCT geometries. Error bars show one standard deviation either side of the mean ()

