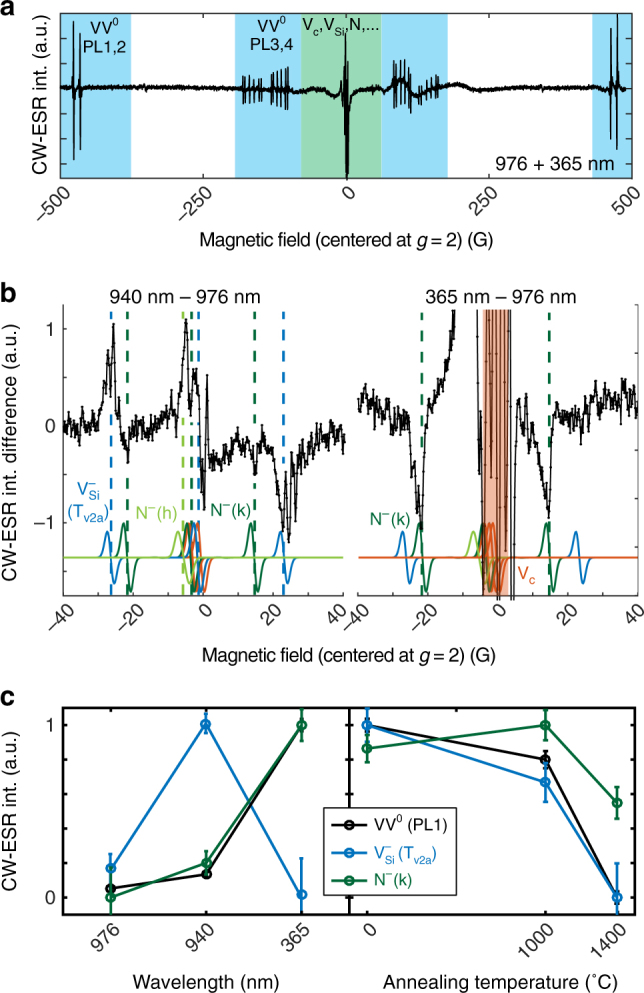
Fig. 4.

ESR at 15 K in semi-insulating 4H-SiC under illumination. a CW-ESR spectrum measured at 9.7 GHz, and centered around g ≈ 2 (≈3470 G, aligned to the c axis). VV PL1–4 are highlighted in blue, while defects such as N, VC, or VSi are close to g ≈ 2 and highlighted in green. b Differential CW-ESR spectrum between either 940 nm and 976 nm excitation (left), or between 365 and 976 nm (right). Gaussian derivative lineshapes are simulated in color for known defects in 4H-SiC18. Their amplitudes only take into account transition probabilities, and not spin polarization or microwave saturation. c Normalized (per defect) CW-ESR intensity under 976, 940, and 365 nm (left) and for different annealing condition of the sample (right). For VV0, 365 nm is combined with 976 nm for spin polarization (and obtain enough signal). For the annealing dependence, the intensity was fitted under the best illumination condition for each defect, that is the maximum signal in the left. Annealed samples were only used in this panel (c, right). Error bars are 95% confidence intervals from the fit
