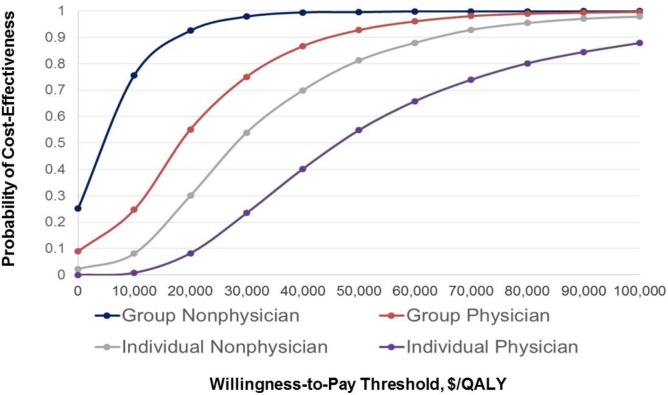
Figure 4: Cost-Effectiveness Acceptability Curves: Examined CBT Strategies Versus Usual Care.
Cost-effectiveness acceptability curves graphically present the probability of the 4 examined CBT strategies being cost-effectiveness versus usual care (i.e., no CBT) across various willingness-to-pay thresholds on the x–y coordinate system. The x-axis shows the probability of cost-effectiveness (range: 0–1), and the y-axis shows various willingness-to-pay thresholds (range: $0–$100,000 per QALY gained).

