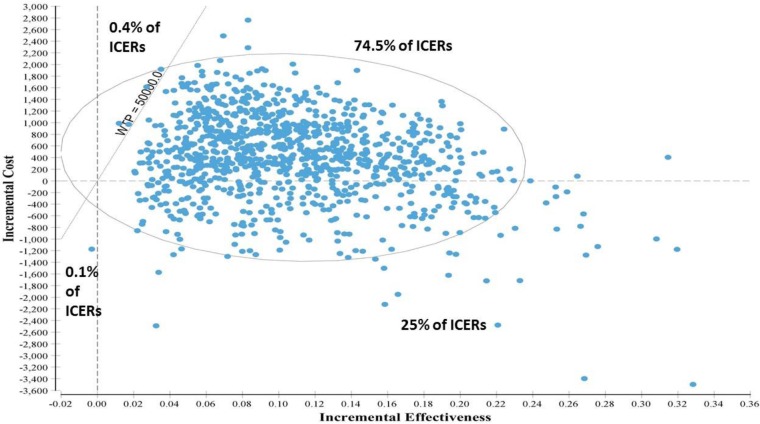
Figure 5: Scatter Plots of 1,000 Simulated Pairs of Incremental Costs and Effectiveness (QALYs) in the Cost-Effectiveness Plane: Group CBT Provided by Nonphysicians Versus Usual Care.
Abbreviations: CBT, cognitive behavioural therapy; ICER, incremental cost-effectiveness ratio; WTP, willingness-to-pay threshold ($).
All costs are in 2017 Canadian dollars and discounted at 1.5%. Effectiveness is expressed in quality-adjusted life years (QALYs). Negative QALYs indicate that the CBT strategy was associated with worse quality-adjusted survival, and negative costs indicate that the CBT strategy saved money relative to usual care. The diagonal grey line indicates a willingness-to-pay threshold of $50,000 per QALY. The incremental cost-effectiveness ratio ($3,715/QALY gained) is the slope of a straight line from the origin that passes through the (0.11 QALY, $400) coordinate. A 95% confidence ellipse covers 95% of the estimated joint density and was used to represent uncertainty around the incremental cost-effectiveness ratio estimated in the probabilistic sensitivity analysis.

