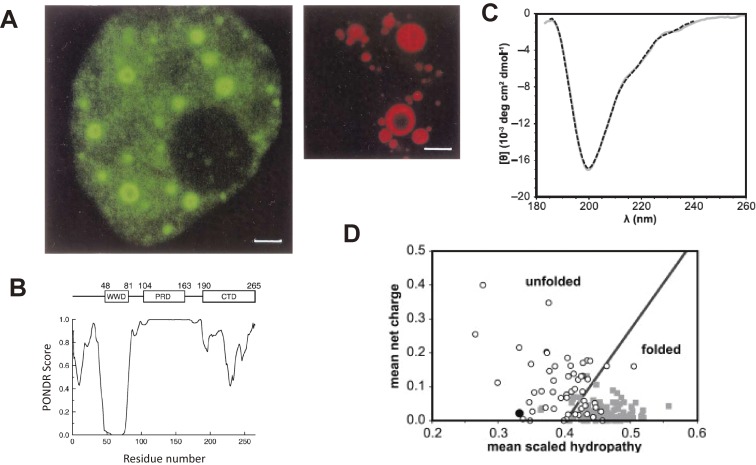
Figure 7.
(A) Nuclear bodies of PQBP1. PQBP1-EGFP (left) and PQBP1-RFP (right) are expressed in cell lines. Reproduced from Okazawa et al., Brain Res Bullet 2001.45) (B) PONDR analysis of the PQBP-1 that predicts C-terminal domain is disordered. Reproduced from Takahashi et al., Biochem Biophys Acta 2009.67) (C) The result from CD analysis of PQBP1 is typical for intrinsically disordered protein. Reproduced from Rees et al., Biophys J 2012.68) (D) Net charge versus hydropathy analysis predict PQBP1 is disordered. Plots are generated from database of folded (gray squares) and unfolded (open circles) proteins. PQBP-1 indicated with a black circle. Reproduced from Rees et al., Biophys J 2012.68)

