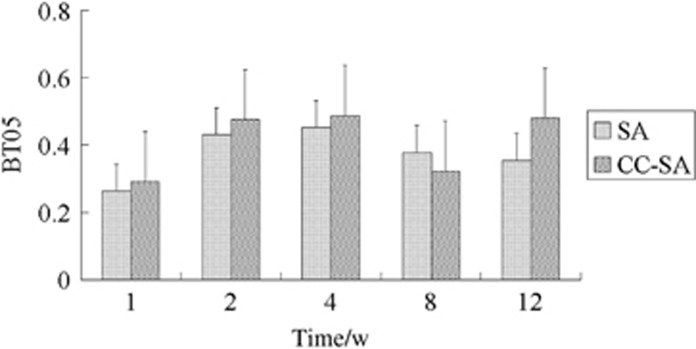
Figure 7.
Bar graph showing the percent bone area at a distance of 0.5 mm from the implant surface except the gap area (BT05). Significant differences were not found between CC-SA and SA implants. Error bars represent means±standard deviation for n=6. CC-SA, calcium carbonate-SA; SA, sandblasted and acid-etched.

