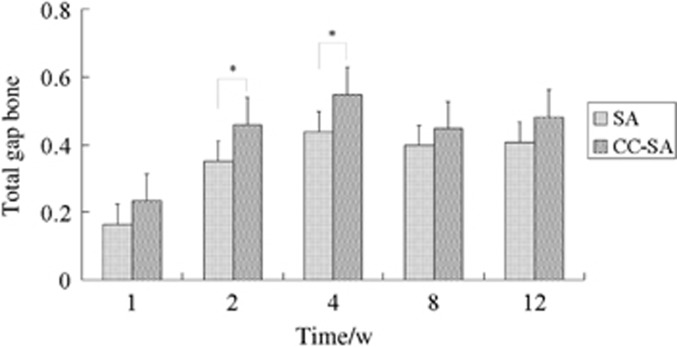
Figure 8.
Bar graph showing the amount of bone inside the gap between the implant and the cancellous bone. The TGB in the CC-SA implants was significantly higher than in the SA implants at 1, 2 and 4 weeks. Error bars represent means±standard deviations for n=6. *P<0.05, **P<0.01. CC-SA, calcium carbonate-SA; SA, sandblasted and acid-etched; TGB, total gap bone.

