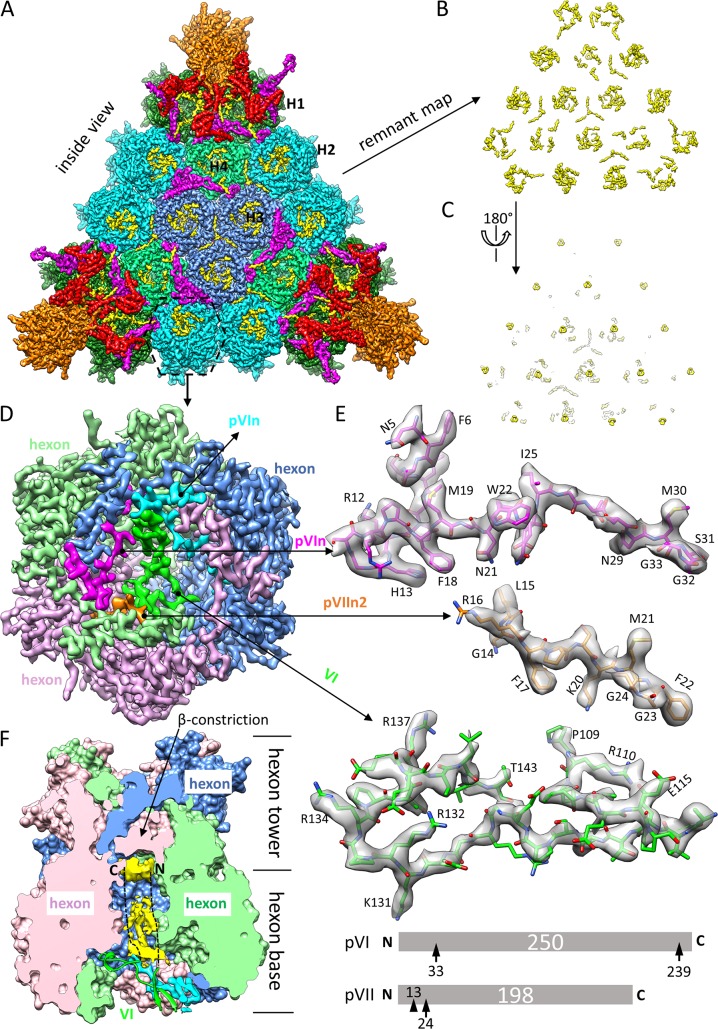
FIG 5.
Identification and modeling of proteins VI, pVIn, and pVIIn2 in the inner cavity of hexon. (A) Facet of Ad5 capsid viewed from inside the capsid. The density map is differentially colored in the same way as in Fig. 1A and B, except that previously unmodeled densities are highlighted in yellow. Note that the unmodeled densities are mainly distributed in the cavities of hexons. (B and C) A “remnant map” was calculated by removing densities of hexon, penton base, and proteins IIIa, VIII, and IX, leaving previously unmodeled densities alone. The density map in panel B is flipped over in panel C to show the cup-shaped densities hiding deeply in the cavity of each hexon, which are attributable to the disordered N- and/or C-terminal region of protein VI. (D) Zoomed-in view of hexon H2. The location of this hexon is marked with a dashed hexagon in panel A. Three subunits of the hexon trimer and the minor proteins in the cavity of the hexon are differentially colored. The hexon trimer is displayed at a threshold of 3δ (δ is the standard deviation), pVIn (cyan or magenta) and pVIIn2 (gold) at a threshold of 2.75δ, and mature VI (green) at a threshold of 1.75δ. (E) Atomic models (sticks) of pVIn, pVIIn2, and VI fitted to their corresponding cryo-EM densities (semitransparent surfaces), with some landmark residues labeled. Only one of the two equivalent copies of pVIn is shown. The schematics at the bottom show maturational cleavages in pVI and pVII. Each precursor protein is represented as a bar, with the polypeptide length (in amino acids) indicated in the center. Consensus cleavage sites are denoted by arrows, and the nonconsensus site is denoted by an arrowhead. (F) Disordered densities hidden deeply in the cavity of hexon H2. The surface presentation of the hexon was calculated by use of atomic models of the hexon trimer, and one half was removed to expose the inner cavity of the hexon. The nomenclature “hexon base,” “hexon tower,” and “β-constriction site” is used following that in the literature (5). Disordered densities (yellow) in the cavity were segmented from the cryo-EM density map and displayed at a threshold of 0.9δ. A model of protein VI (green ribbon) crossing the opening of the cavity is also shown. The two dashed lines denote that the disordered densities are speculated to be attributable to the unmodeled N- and C-terminal regions of protein VI.

