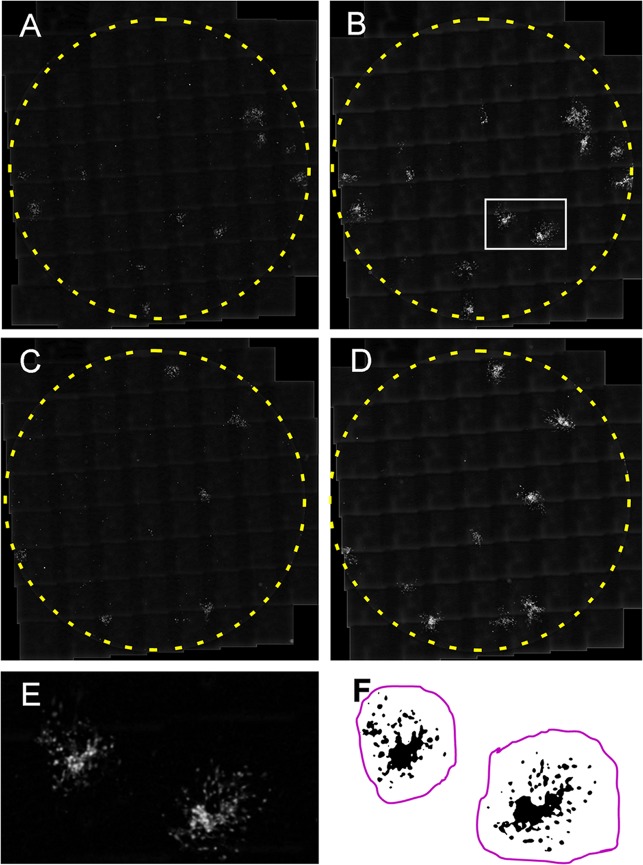
FIG 4.
Analysis method for growth of individual foci of VZV infection in ARPE19 cells after transfection of a control RNA (A and B) or a locked antagonist RNA to VZVsncRNA23 (C and D). Eighty-one micrographs covering more than 95% of wells in a 96-well culture plate were taken with an automated microscope 1 day after transfection (2 dpi in panels A and C) and 6 days after transfection (7 dpi in panels B and D) and assembled (“stitched” together) using the program Fiji. The area enclosed by the white rectangle in panel B is shown at higher magnification in panel E. The infectious focus is blurred because it has been treated with a Gaussian filter to eliminate photographic artifacts and smooth the outlines of the infected cells. Panel F shows a thresholded image used for measurements. Black indicates RFP fluorescence indicating the presence of virus, and the magenta line indicates the area to be measured as one infectious focus.

