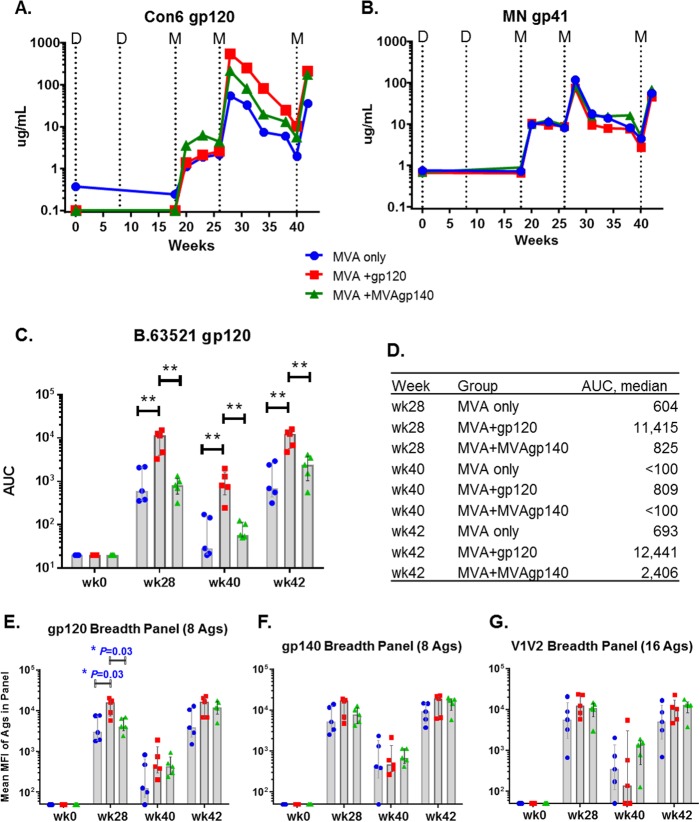
FIG 1.
Magnitude and breadth of binding antibody responses. (A and B) Group median IgG binding magnitude for Con6 gp120 (A) and MN gp41 (B) of longitudinal sera measured in ELISA. Dotted lines indicate time of immunizations. D, DNA prime at weeks 0 and 8; M, MVA boost at weeks 18, 26, and 40. (C and D) Binding AUC (measured in BAMA) for individual animals (C) and for group medians (D) to B.63521 gp120. (E to G) Mean MFI for binding to the gp120 (C), gp140 (D), or V1V2 (E) breadth panel measured in BAMA. MFIs for gp120 and gp140 antigens were obtained from 1:400 plasma dilutions. MFIs for V1V2 antigens were obtained from 1:80 plasma dilutions. Each symbol represents binding by one plasma sample to one antigen panel. Shaded bars represent group median values and error bars represent interquartile ranges. Group median values are also listed in Table 1. *, P < 0.05 for pairwise comparison (exact Wilcoxon rank sum; values shown in Table 2). All differences are insignificant once adjusted for multiple comparison (Table 2).

