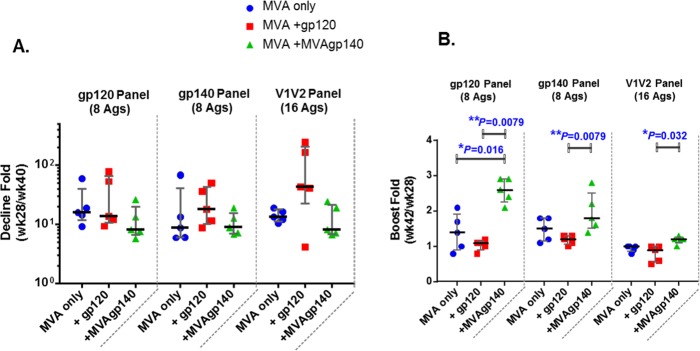
FIG 2.
Contraction (A) and fold boost (B) of binding response for 3 antigen panels. Contraction was calculated as week 28/week 40 mean MFI for binding to the antigen panel. Fold boost was calculated as week 42/week 28 mean MFI for binding to the antigen panel. Each symbol represents the calculated ratio for each sample. Error bars represent group medians and interquartile ranges. *, P < 0.05, and **, P < 0.01, for pairwise comparison (exact Wilcoxon rank sum; values shown in Table 2). All differences are insignificant once adjusted for multiple comparison (Table 2).

