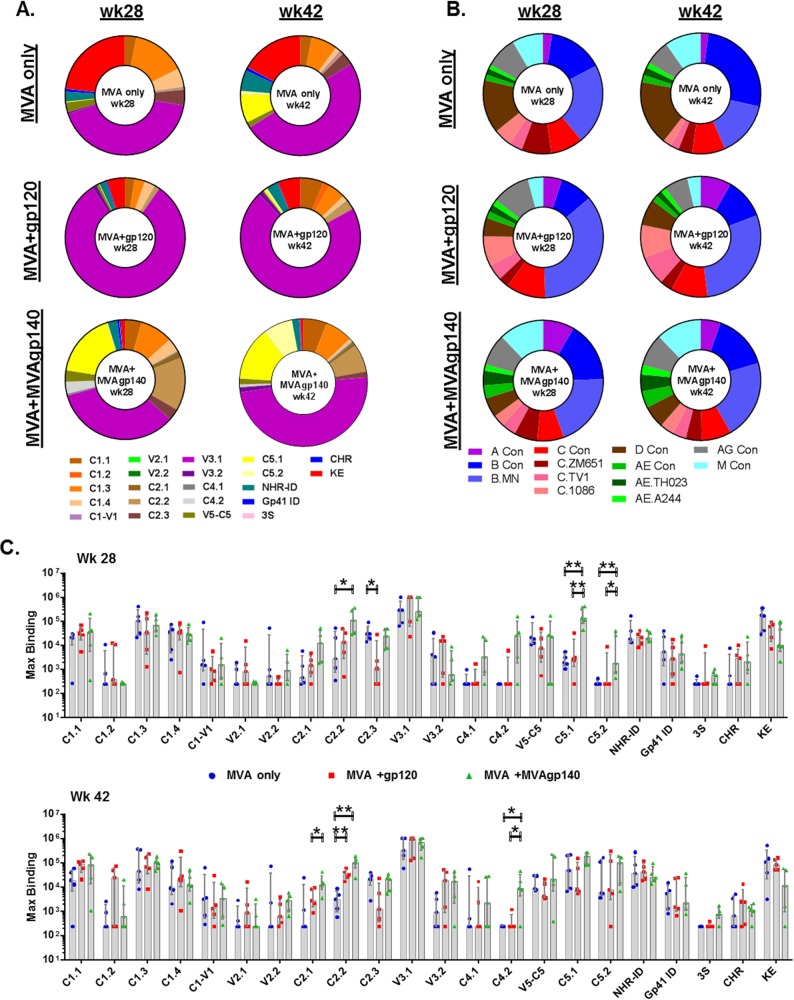
FIG 3.
Proportions of total linear binding to each identified epitope (A) or to each strain included in the epitope mapping peptide library (B) and magnitude of binding to each epitope identified (C). Each sector in panel A represents a group median magnitude to an epitope, which was calculated as the highest binding to a single peptide within each epitope region as defined in Table 3. Each sector in panel B represents a group median total linear epitope binding for a strain, which was calculated as the sum of binding intensities to all linear peptides for that strain. Values in panel C are the highest binding to a single peptide within each epitope region. Bars represent group medians and whiskers represent interquartile ranges. *, raw_p < 0.05; **, raw_p < 0.01 (Table 2).

