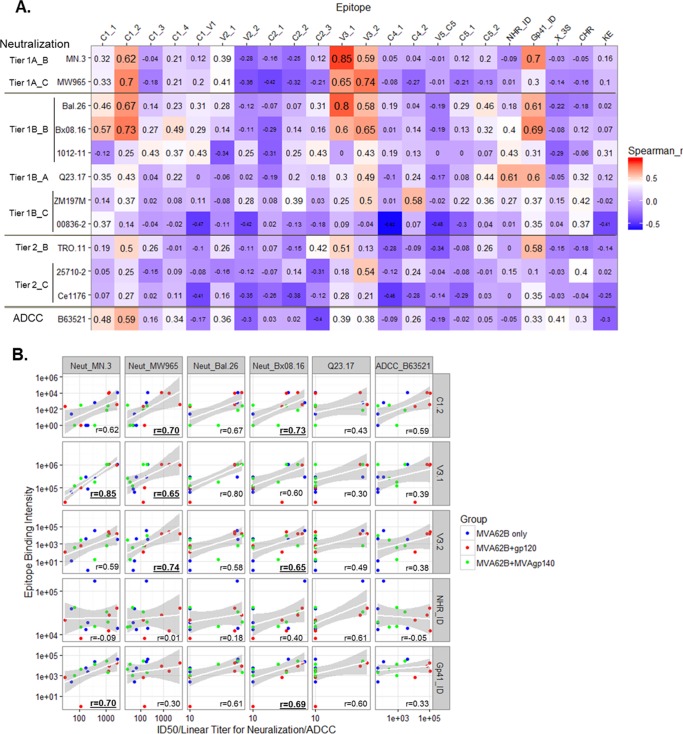
FIG 6.
(A) Heat map of r values for Spearman correlation analyses between neutralization ID50 and ADCC titers and binding for each linear epitope; (B) scatter plots showing parameters with r values of >0.6 in at least one correlation test. Test sizes of values in the heat map are proportional to the values in panel A. Labels on the left of the virus isolate list indicate the tier and clade of each isolate. Symbols in panel B are color-coded by vaccine groups as indicated, and r values that are bold and underlined are with raw_p values of <0.01 (Table 4).

